
HR - Inventory Utilisation
Overview
In this example, we take data from two sources: (i) Timesheets, and (ii) Employee Availablility data from a well-designed HR ERP, to show quite an important metric: Inventory Utilisation!
This can give us better visibility and a better understanding of how well staff are resourced across a business.
Inventory Availability
Let us start with the following data from your HR ERP.

Click to view large-sized image
This shows the availability history of each Employee. This is obviously a slowly changing dimension – as each employee’s profile seldom stays the same, so we have a new record for each change in: “Country”, “Department”, “Full or Part Time” working status, “Preferred Days Worked”, and/or “Hours worked per Day”.
(We, of course, assume here you have a HR ERP that actually supports such data recording!)
Holiday Data
Next, let us assume that we also have the following Holiday data, showing days that are Public Holidays, for each geographic region.
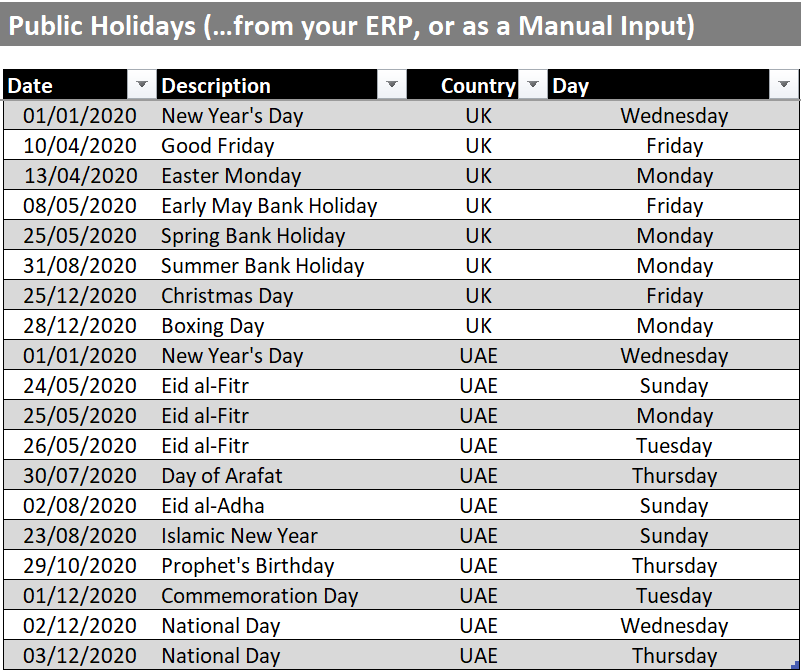
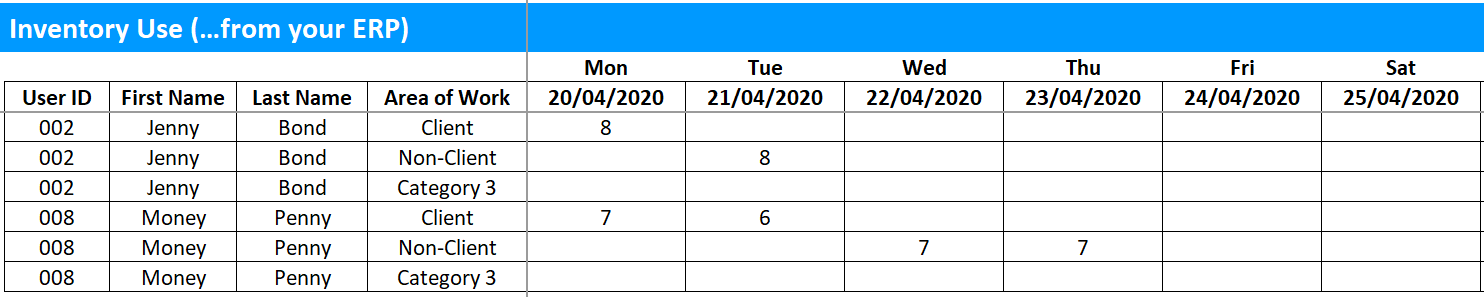
Timesheet Data
Finally, let us assume we have good detailed Timesheet data, in the following format, where entries are booked by each Employee in hours (we have only shown 3 categories here, but you can be as granular with timesheet bookings here, as you want. You could also include extra fields here too such as, any ‘Project Codes’, ‘Internal Codes’, or ‘Status Codes’, in addition to the ‘Area of Work’ field – again, provided your ERP can support it!):
Important: The timesheet data should exclude any hours that may be booked automatically because of holidays. This is because we plan to also exclude public holidays from available hours, before calculating Inventory Utilisation (which in essence would just be: Actual hours worked / Available hours, for whichever time window is being observed)
Steps:
Showing Inventory Utilisation is quite an involved process. Even from the little data given above, doing this accurately is not as easy as it initially might seem. To get the data in the right form, and go through all the necessary calculations, at least the way we’ve done it, we count in total, about 140 transformation operations!
We now go through, each step, in the remainder of this article, one by one, so you can understand the logic being used, and any internal workings – well enough, at least, for you to be able to experiment and explore with your own methods.
List all dates from the Timesheet data:
- To start with, load the Timesheet Data that you have into Power Query, so it looks something like this:
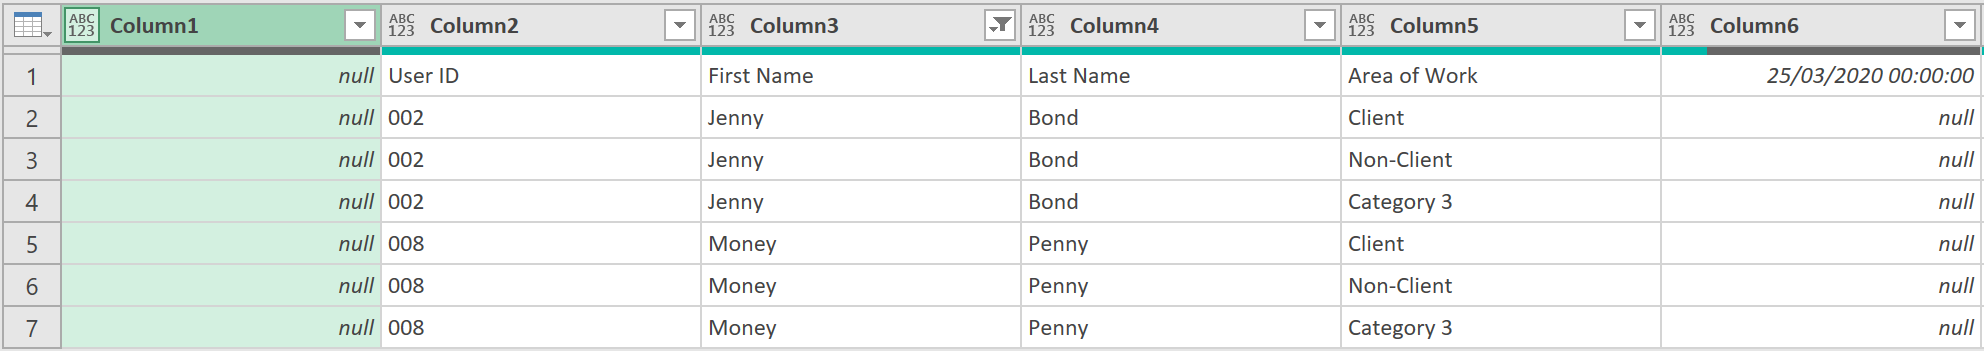
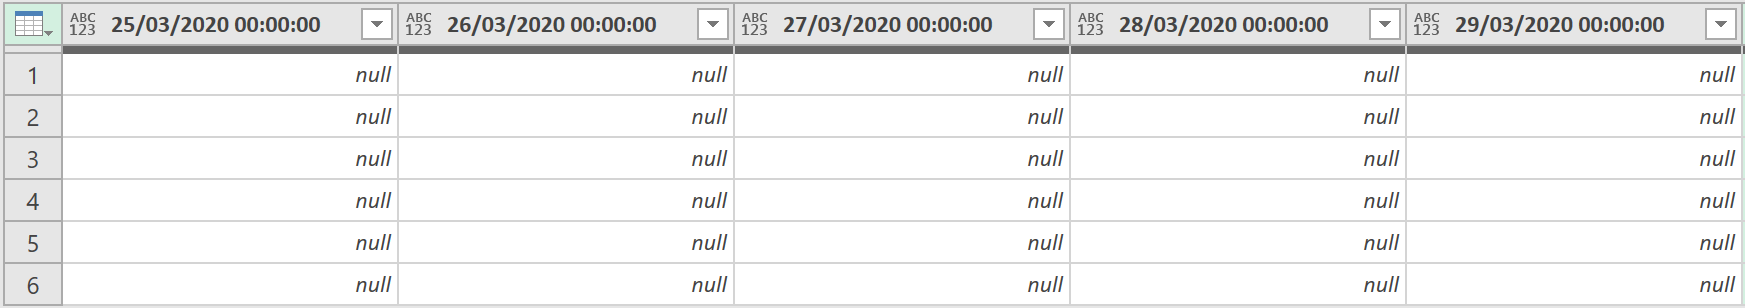
- Now, remove columns 1 to 5, as they are not needed for this query
- Promote the headers of the remaining columns.
The data should look like this:
- Unpivot all columns, so the data now looks like this:
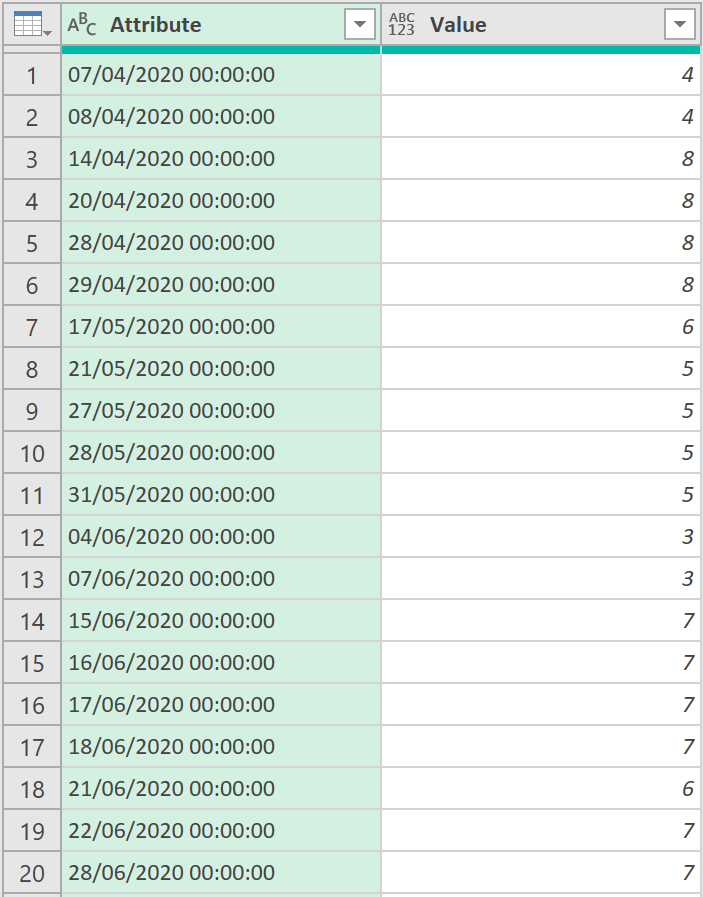
- Remove the ‘Value’ column as it is also not needed for this query
- Filter the ‘Attribute’ column, to include only those rows with a ‘/’, to ensure any rows with no Dates in them are removed. Use the following ‘M’ code:
= Table.SelectRows(#"Removed Columns1", each Text.Contains([Attribute], "/"))
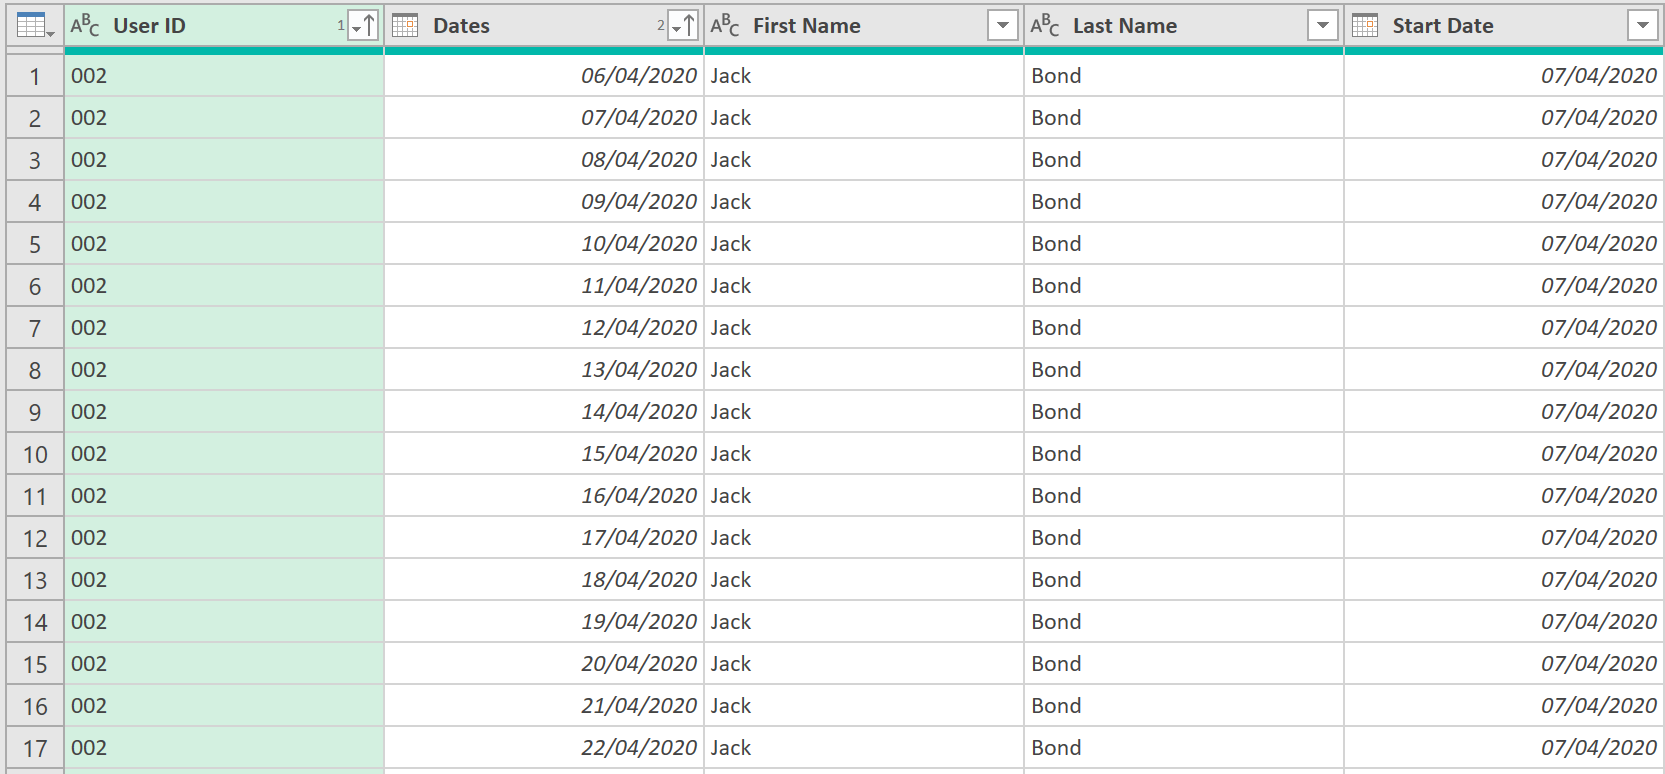
- Next, change the field type to ‘Date/Time’
- Rename the column to ‘Dates’, so the data now looks like this:
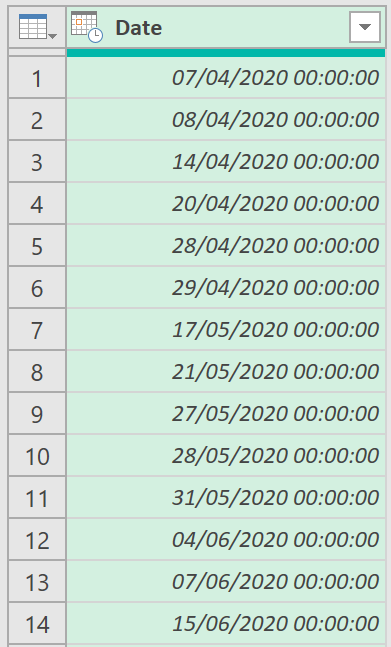
- Now, change the field type to just ‘Date’
- Remove duplicates, just in case there are any duplicate dates
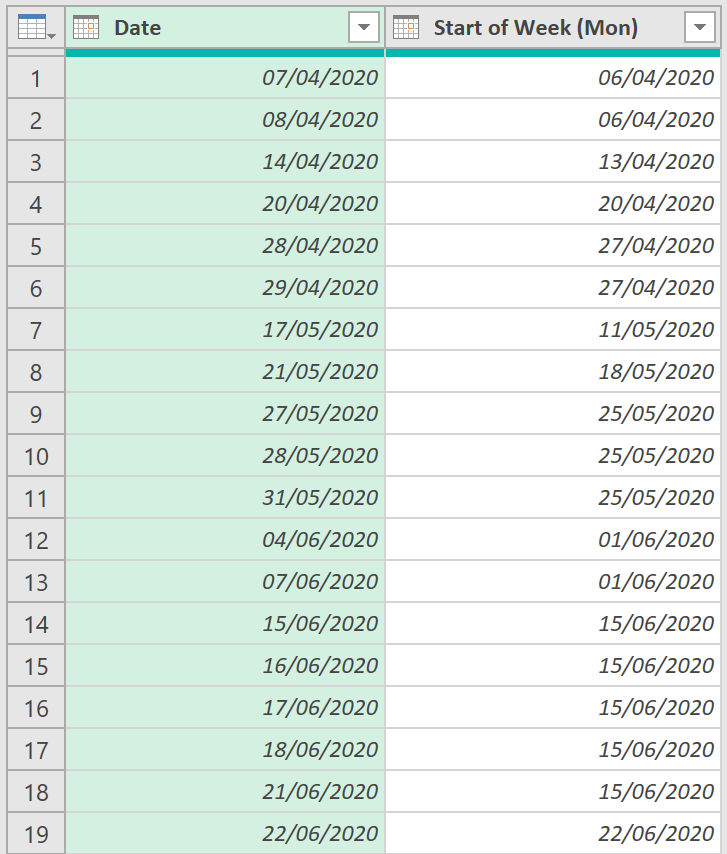
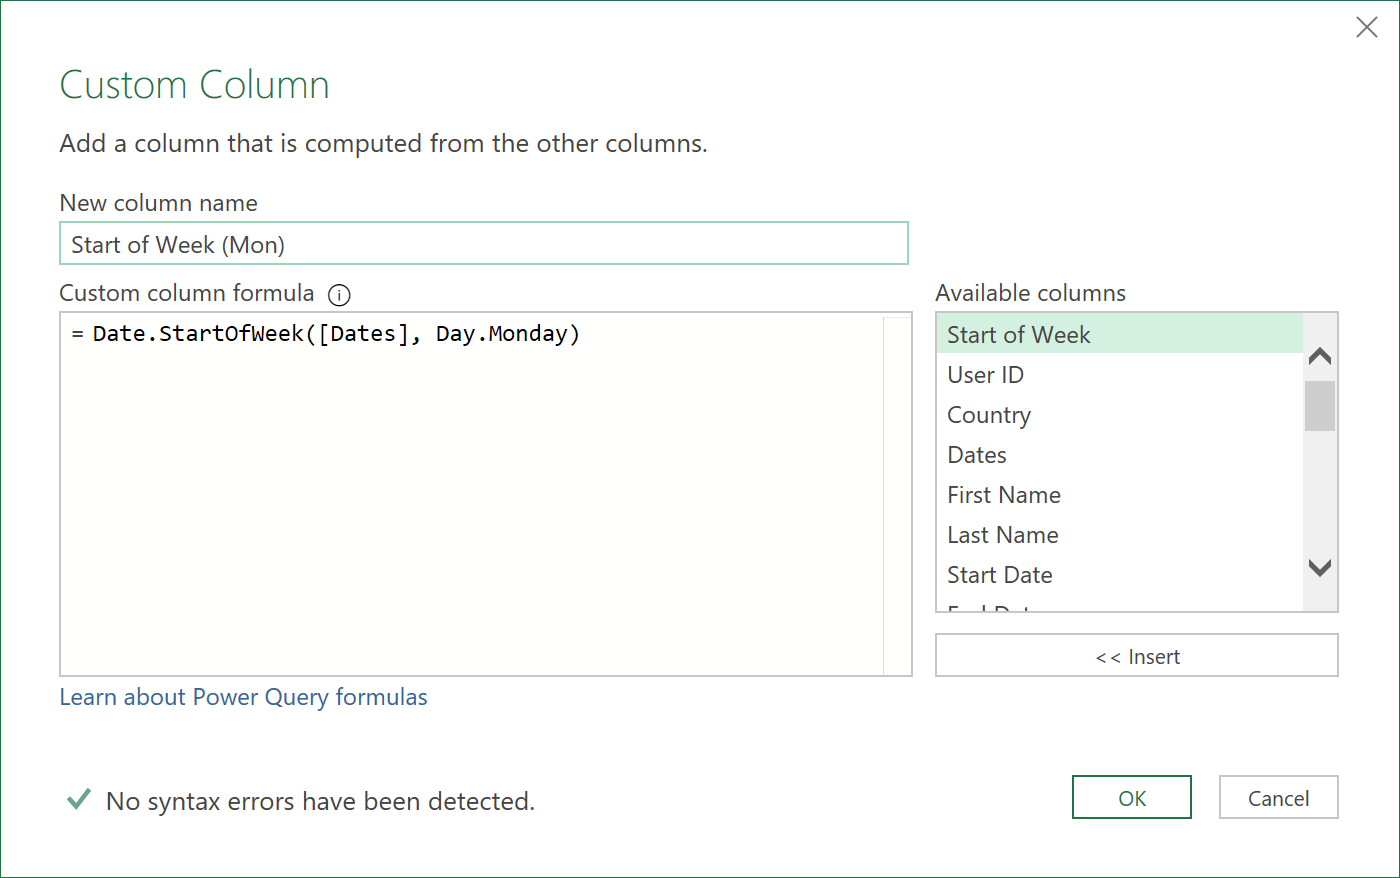
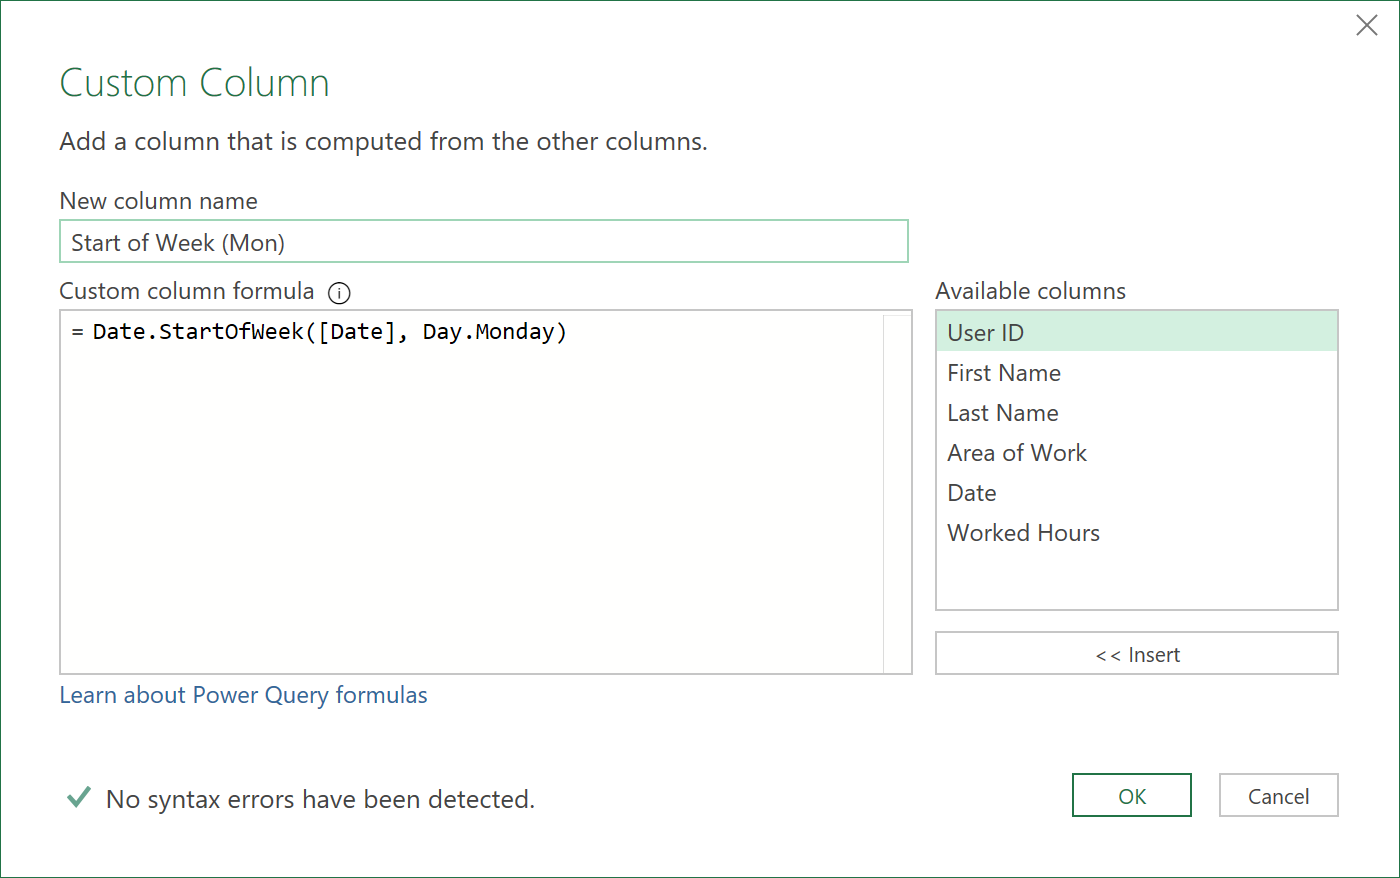
- Add a ‘Start of Week (Mon)’ column, using the following ‘M’ code:
= Table.AddColumn(#"Removed Duplicates", "Start of Week (Mon)", each Date.StartOfWeek([Date], Day.Monday), type date)
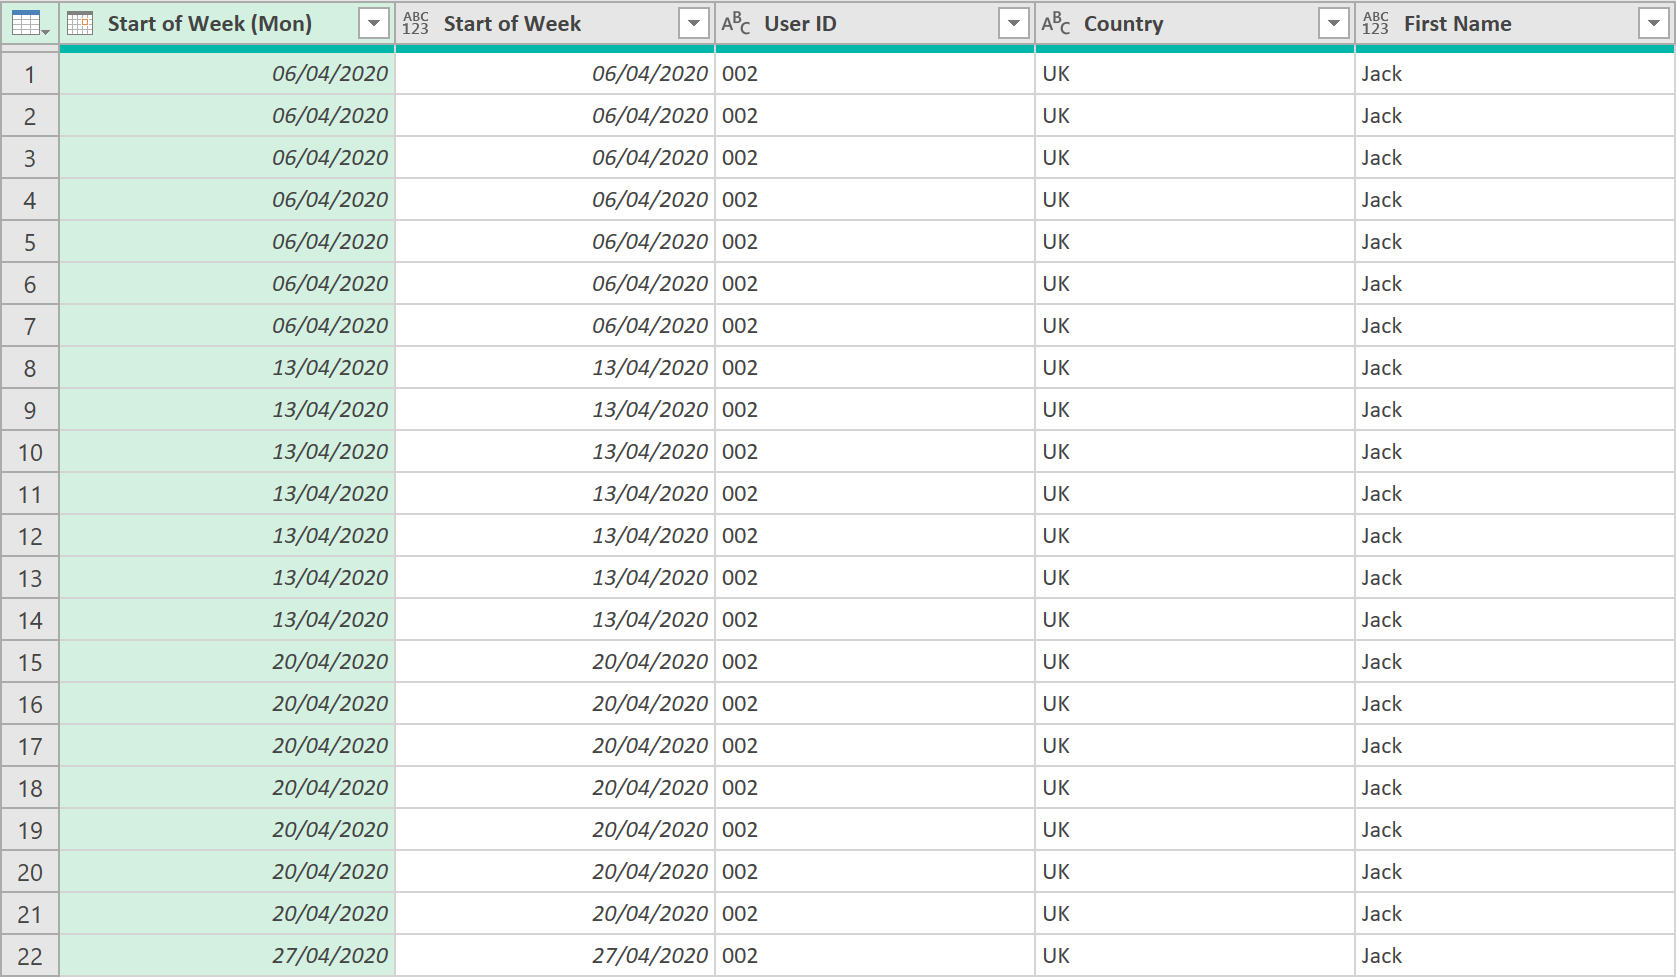
The data should now look like this:
- Call the query, ‘Set Dates’
- The final ‘M’ code of this query should look something like this:
let
    Source = Excel.CurrentWorkbook(),
    Inventory_Use = Source{[Name="Inventory_Use"]}[Content],
    #"Filtered Rows" = Table.SelectRows(Inventory_Use, each ([Column3] <> null)),
    #"Removed Columns" = Table.RemoveColumns(#"Filtered Rows",{"Column1", "Column2", "Column3", "Column4", "Column5"}),
    #"Promoted Headers" = Table.PromoteHeaders(#"Removed Columns", [PromoteAllScalars=true]),
    #"Unpivoted Columns" = Table.UnpivotOtherColumns(#"Promoted Headers", {}, "Attribute", "Value"),
    #"Removed Columns1" = Table.RemoveColumns(#"Unpivoted Columns",{"Value"}),
    #"Filtered Rows1" = Table.SelectRows(#"Removed Columns1", each Text.Contains([Attribute], "/")),
    #"Changed Type" = Table.TransformColumnTypes(#"Filtered Rows1",{{"Attribute", type datetime}}),
    #"Renamed Columns" = Table.RenameColumns(#"Changed Type",{{"Attribute", "Date"}}),
    #"Changed Type1" = Table.TransformColumnTypes(#"Renamed Columns",{{"Date", type date}}),
    #"Removed Duplicates" = Table.Distinct(#"Changed Type1"),
    #"Inserted Start of Week (Mon)" = Table.AddColumn(#"Removed Duplicates", "Start of Week (Mon)", each Date.StartOfWeek([Date], Day.Monday), type date)
in
    #"Inserted Start of Week (Mon)"
Find Min Date
- Now, create a query called ‘Min_Date’ that references to the ‘Set Dates’ query just created
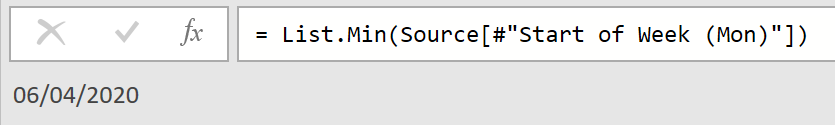
- Add a Custom Step, to find the minimum Date, using the following ‘M’ code:
= List.Min(Source[#"Start of Week (Mon)"])
Only one value should be returned, like so:
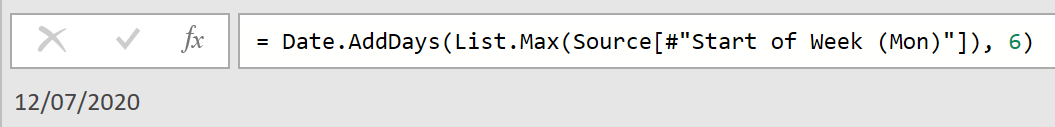
Find Max Date
- Now, create a query called ‘Max_Date’ that also references the ‘Set Dates’ query
- Add a Custom Step, to find the maximum Date (which should be the end of the week this time), using the following, slightly different, ‘M’ code:
= Date.AddDays(List.Max(Source[#"Start of Week (Mon)"]), 6)
One value should be returned, like so:
Show Inventory Availability by day – shortfall check (adding dates)
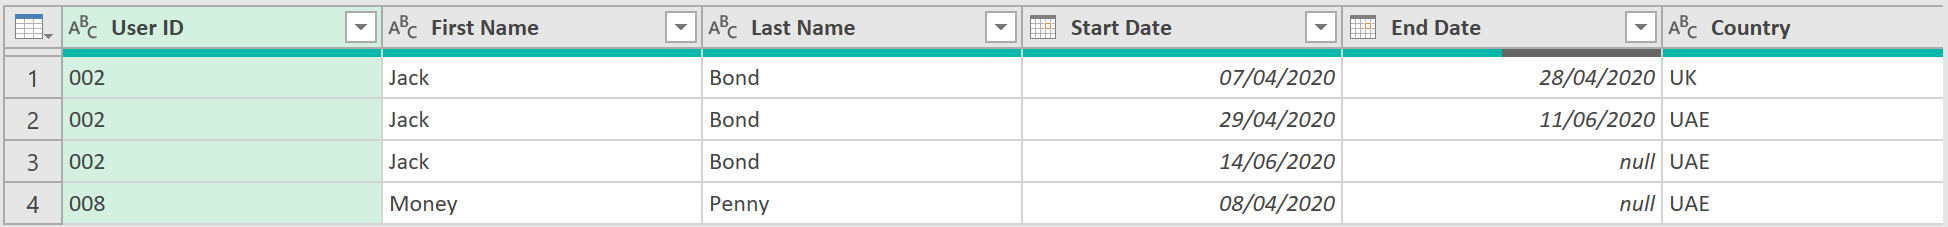
- Now, in a new query, load the Availability data you have into Power Query so it looks like this:
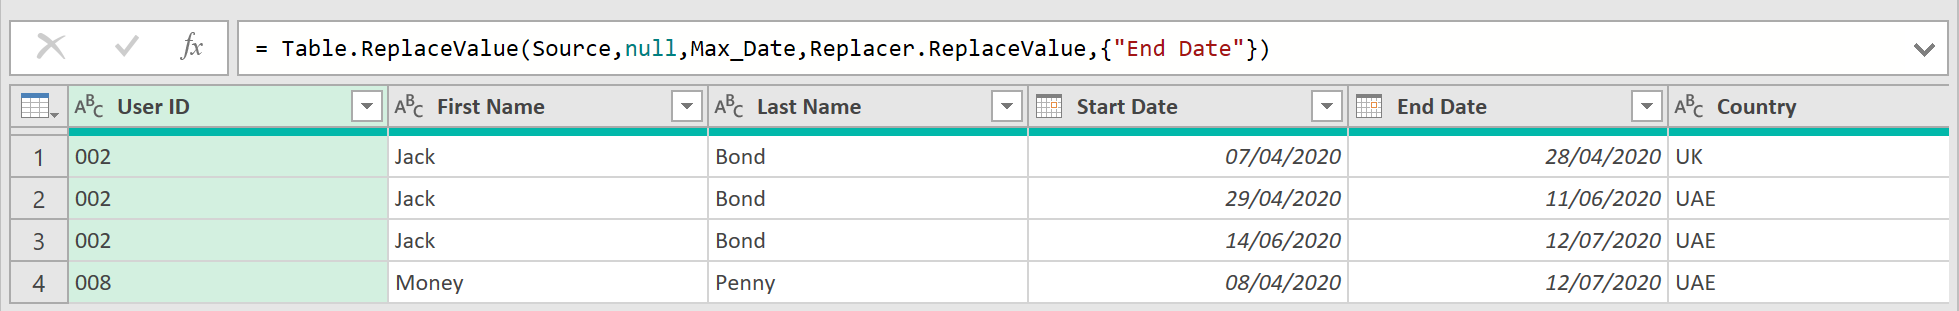
- Fill in the End Date column, with the date from the ‘Max_Date’ query just created:
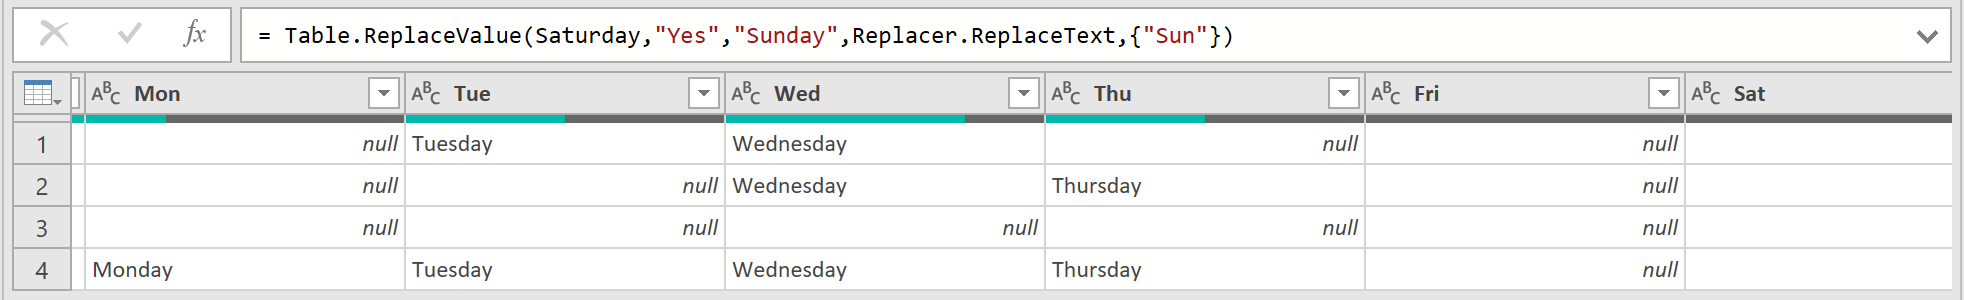
- Replace the any cells that say ‘Yes’ in the column called ‘Mon’ with ‘Monday’, like shown below:
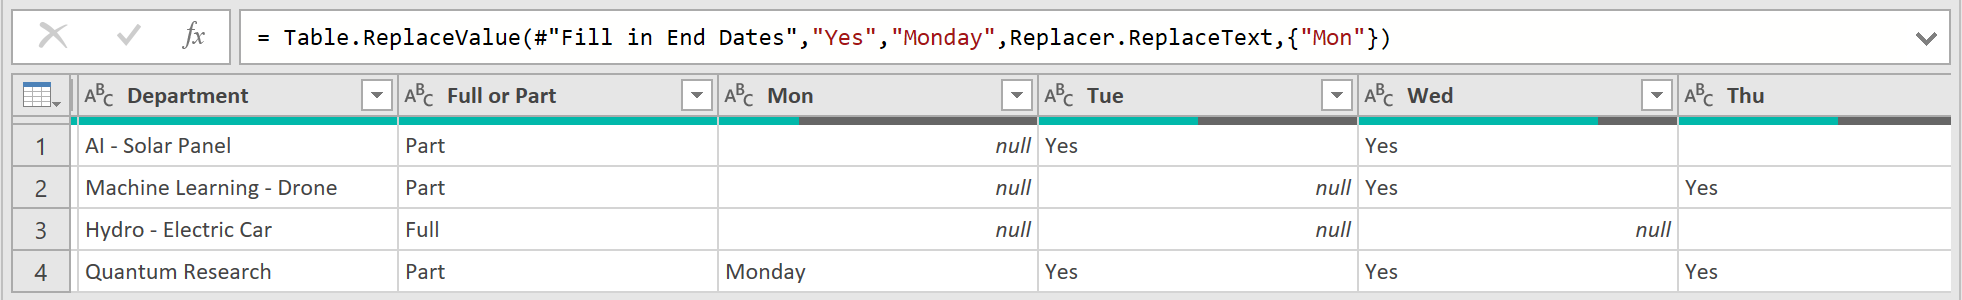
- Do the same for all the other days:
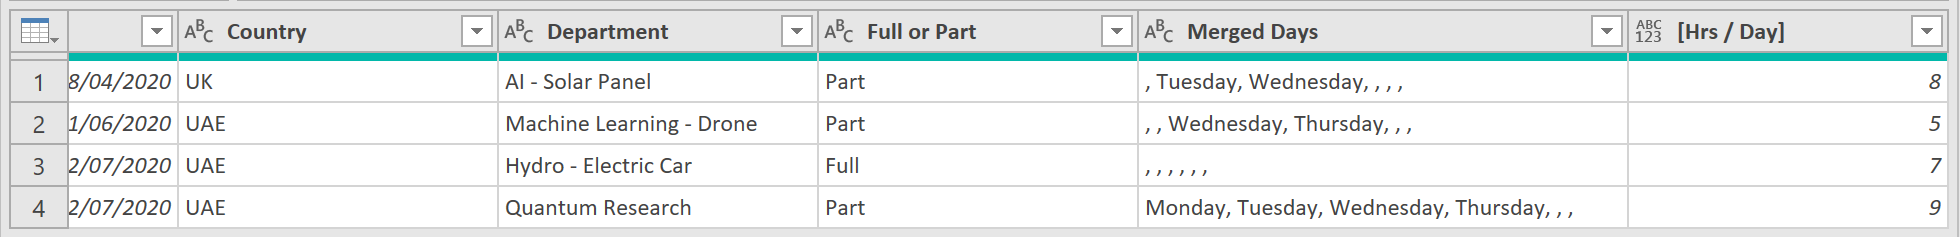
- Now, merge all the day columns into one, using the following ‘M’ code:
= Table.CombineColumns(Sunday,{"Mon", "Tue", "Wed", "Thu", "Fri", "Sat", "Sun"},Combiner.CombineTextByDelimiter(", ", QuoteStyle.None),"Merged Days")
The new column should look like this:
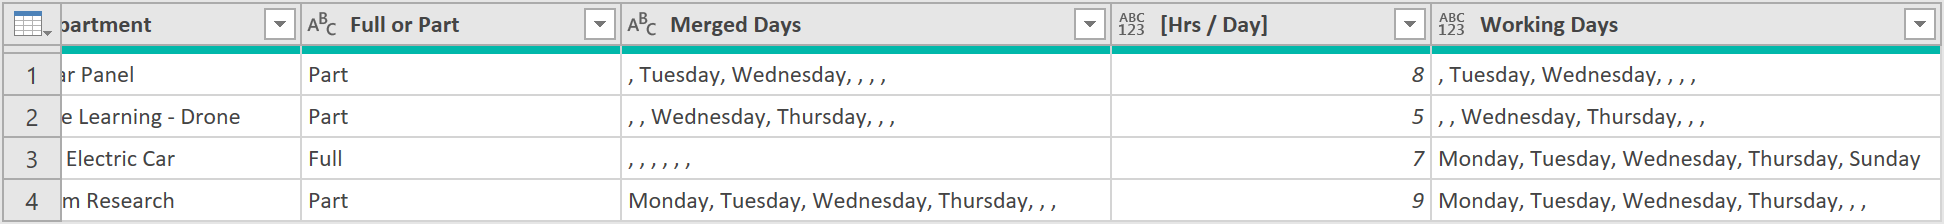
- Add a new custom column, with the following logic, that takes the data from the ‘Merged Days’ column and combines it with the rows where we know an Employee is working a Full week:
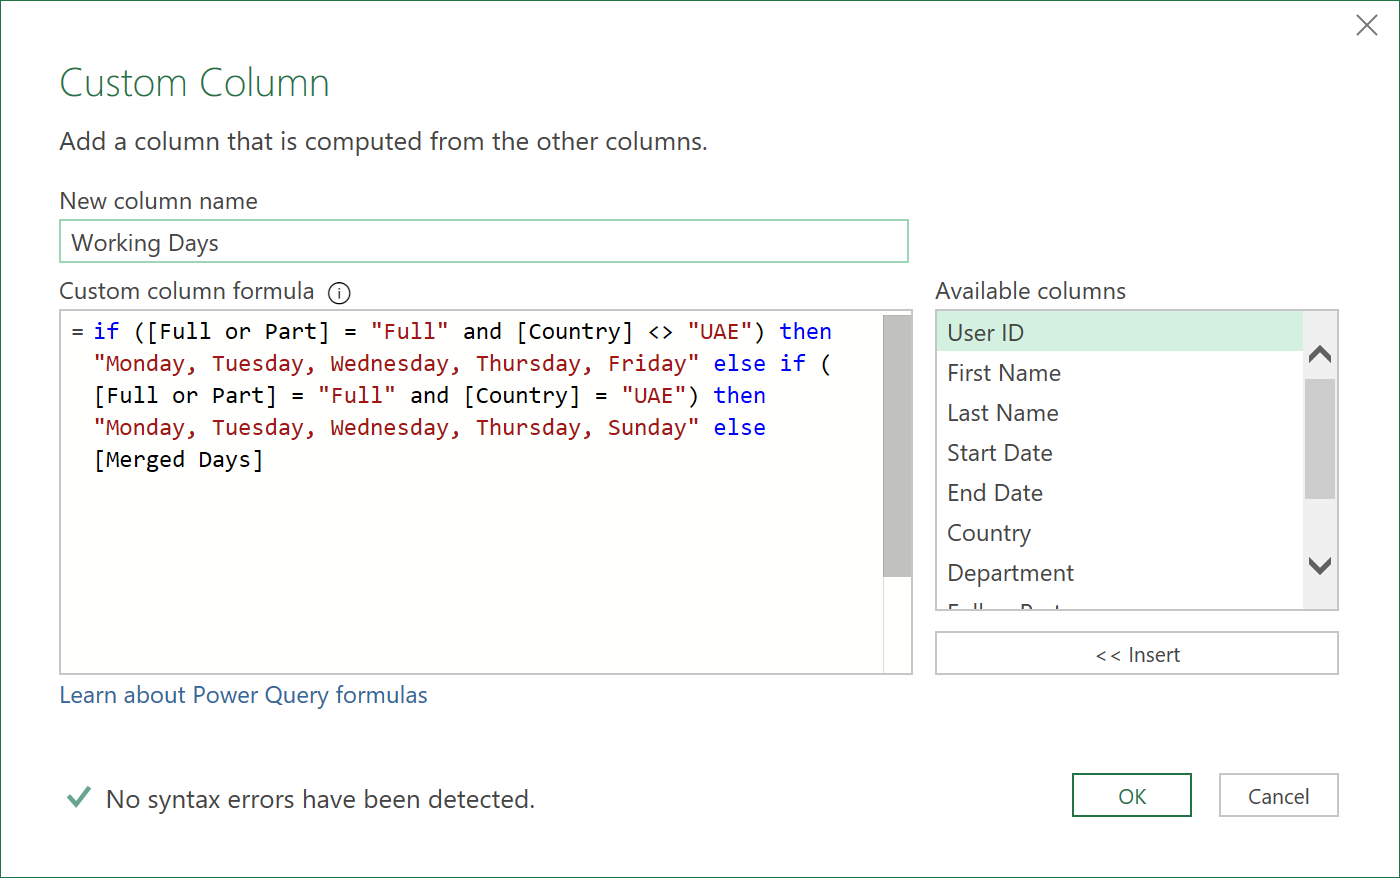
This should return a ‘Working Days’ column, like shown below:
-
Remove the column, called ‘Merged Days’ as it is now no longer needed – we have the ‘Working Days’ column
-
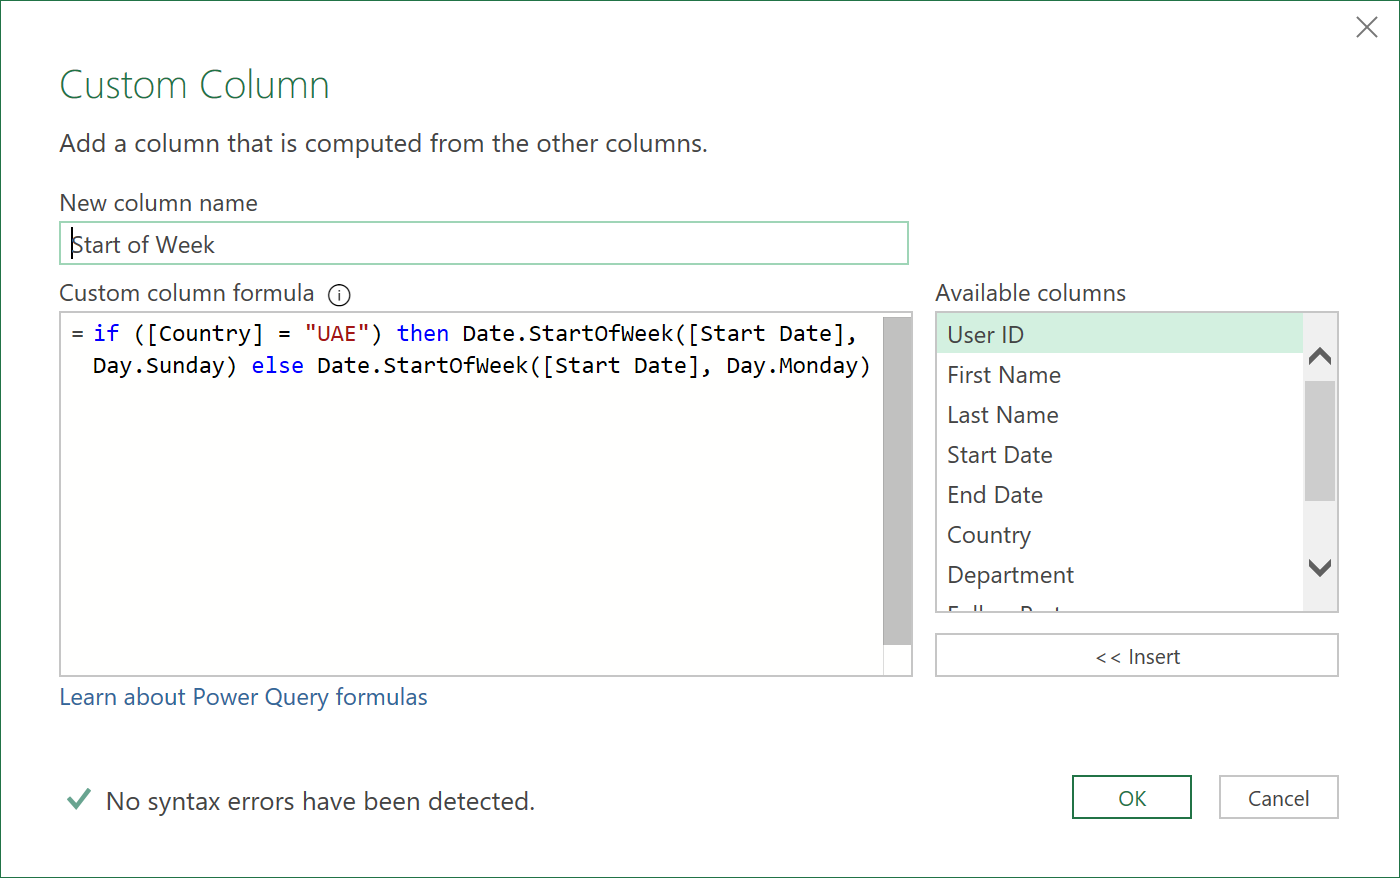
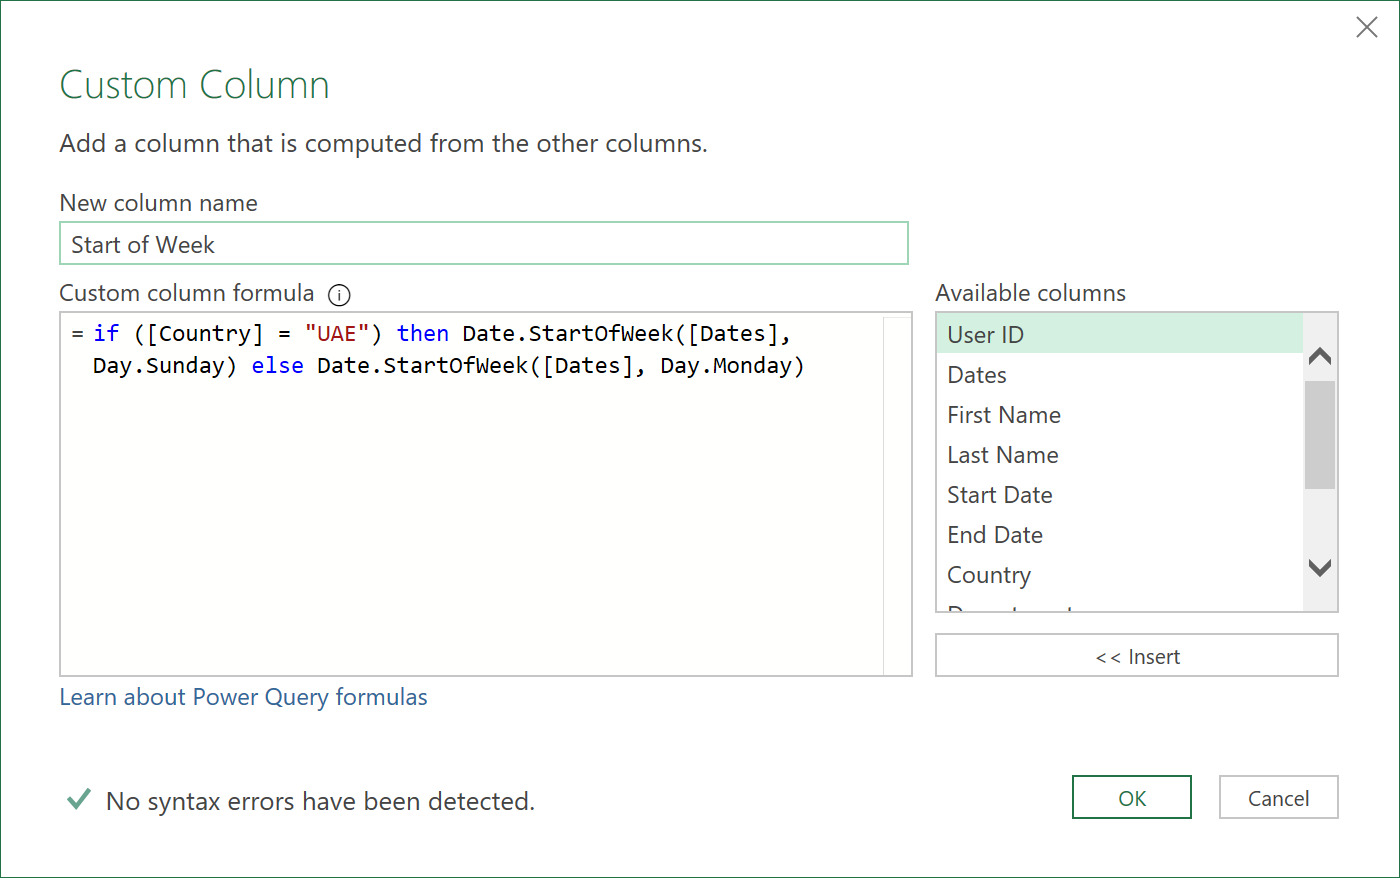
Add a ‘Start of Week’ column, with the following logic that takes into account the fact that different geographic regions may start on different days of the week:
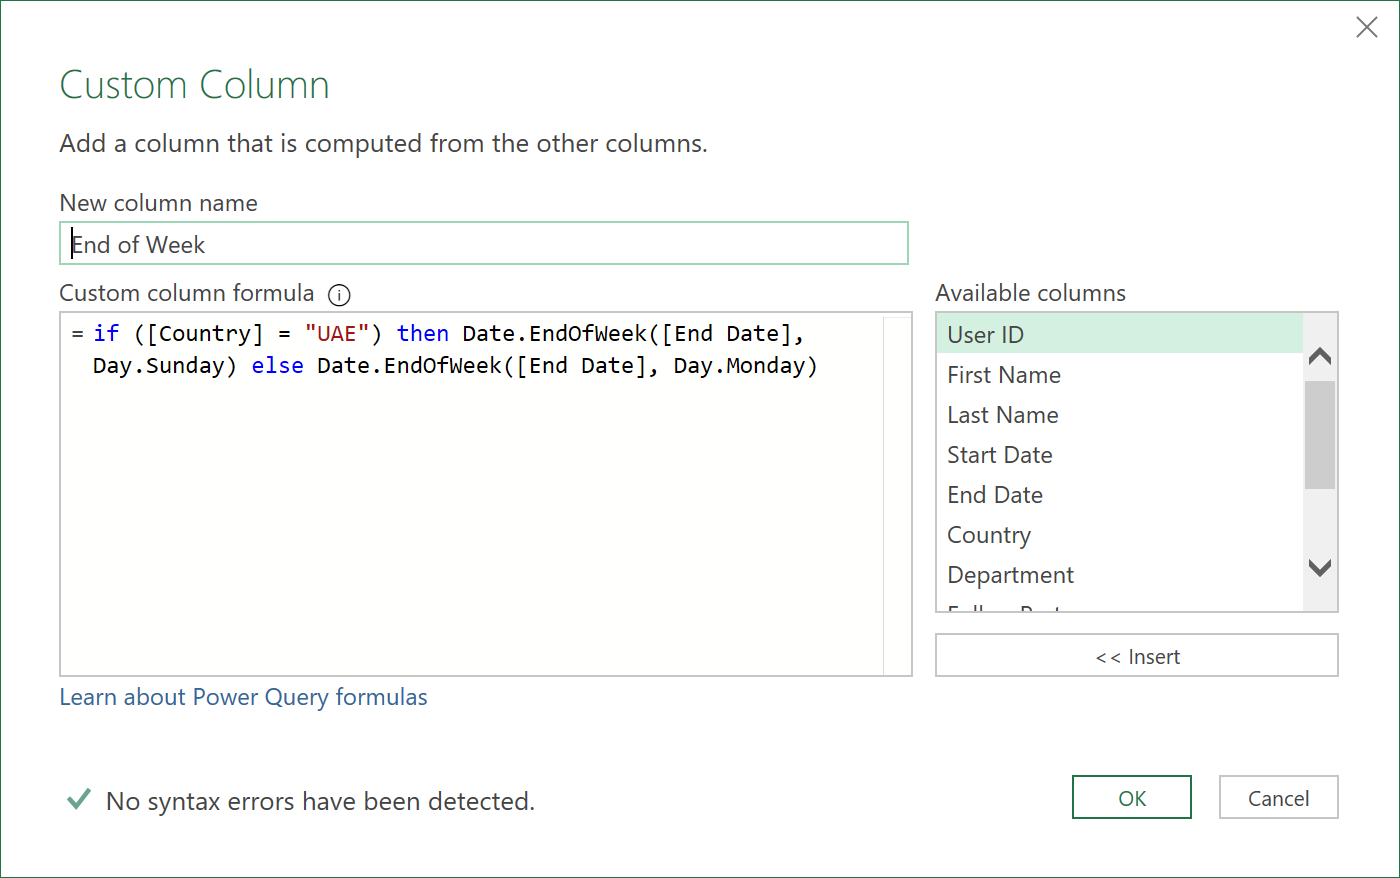
- Similarly, add an ‘End of Week’ column, with the similar logic:
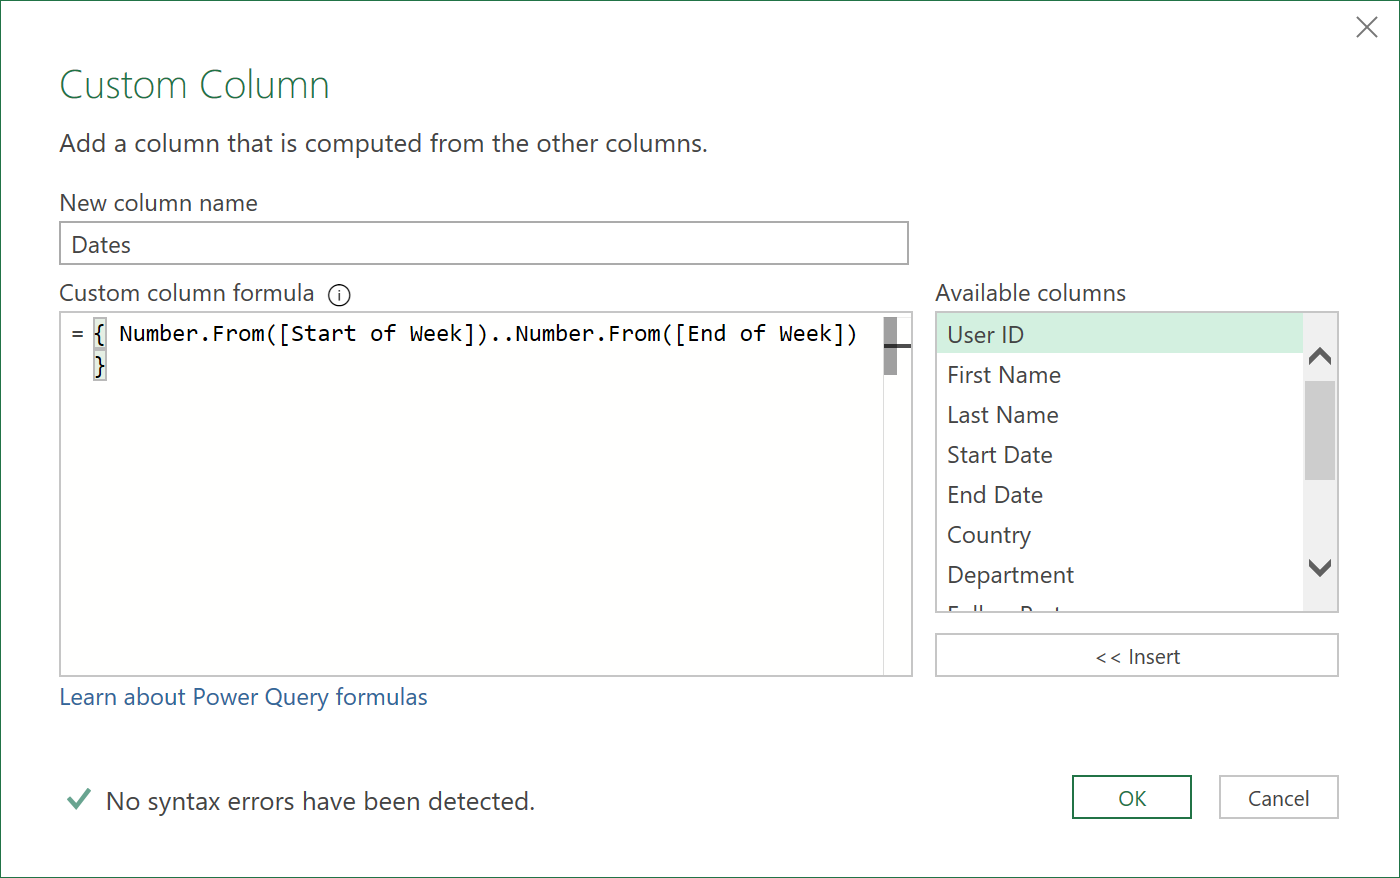
- Now, add a Custom column called ‘Dates’ like so, to list all the days between the ‘Start of Week’, and ‘End of Week’ values recorded in each row of data:
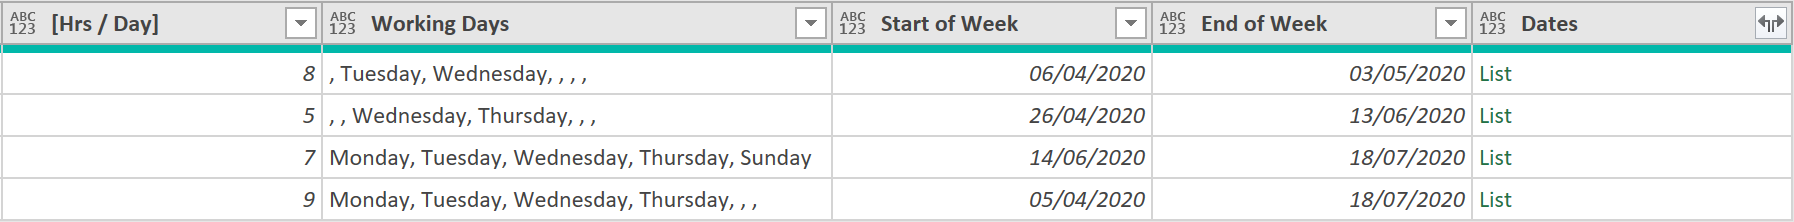
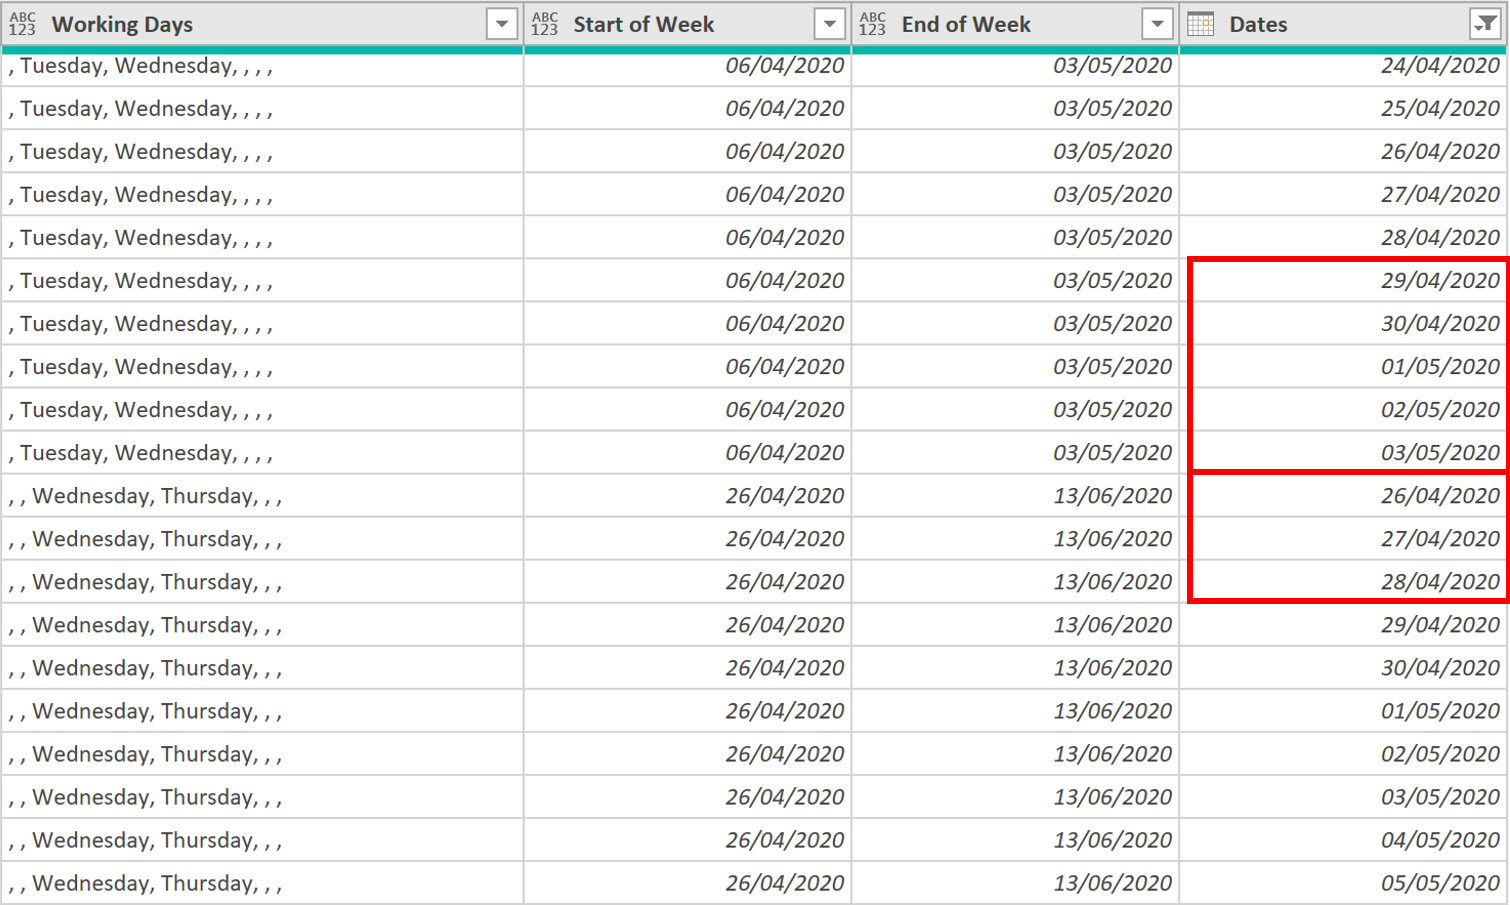
- The last few columns of data should now look something like this, with a list object added to each row, under the heading “Dates”:
- Now, expand the ‘Dates’ column
- Change its data type to ‘Date’
- Apply also a filter to the ‘Dates’ column to only include dates that are less than or equal to the ‘Max_Date’and greater than or equal to the ‘Min_Date’ that were calculated earlier from the Timesheet data
= Table.SelectRows(#"Changed Type", each [Dates] >= Min_Date and [Dates] <= Max_Date)
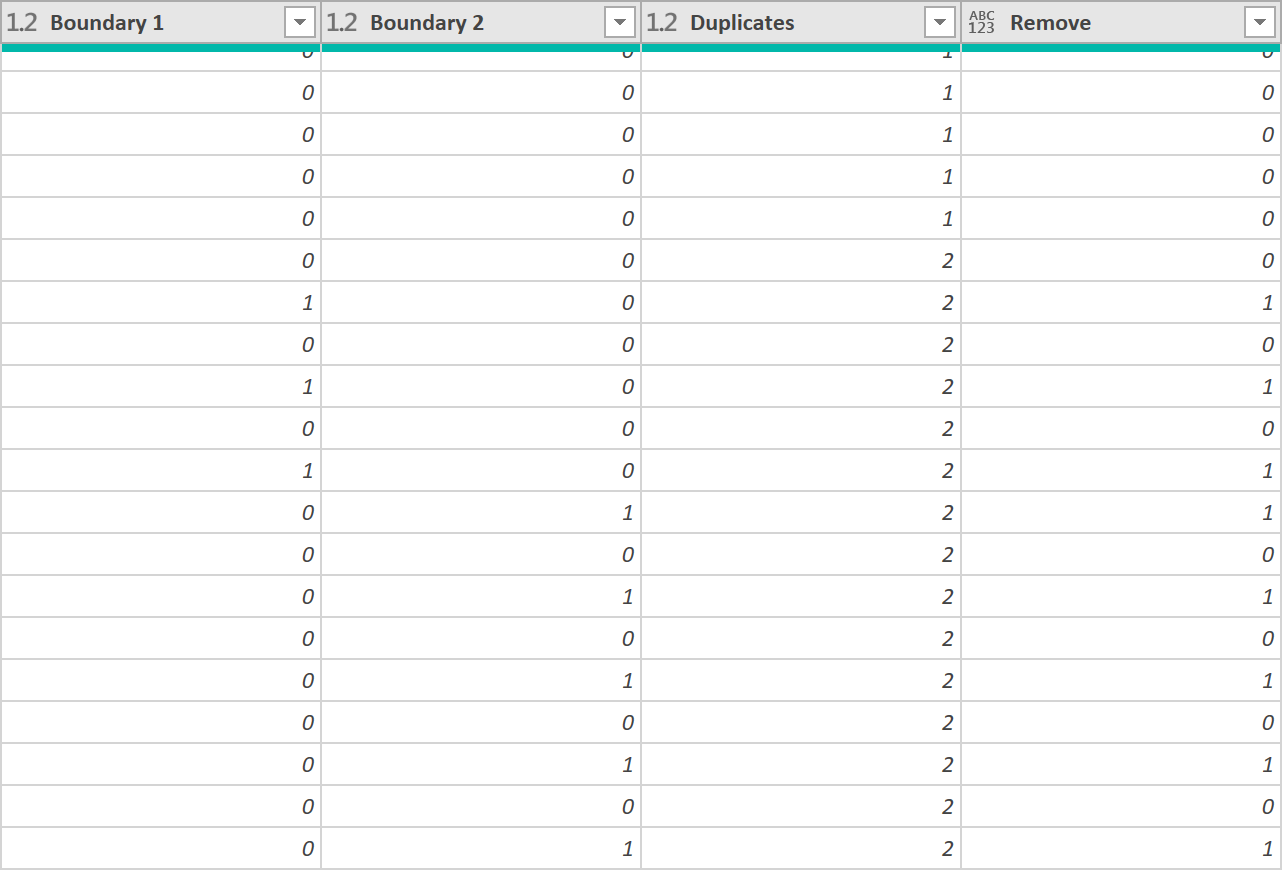
- Although the data looks ok, there are some duplicate rows that have been created from the earlier List Expand operation that we should remove. Refer to the picture below. The rows boxed in red should be removed, as these dates already exist in the ‘Dates’ column (see just above and just below the red boxed areas)
- To remove these rows, add the following two binary conditional columns:
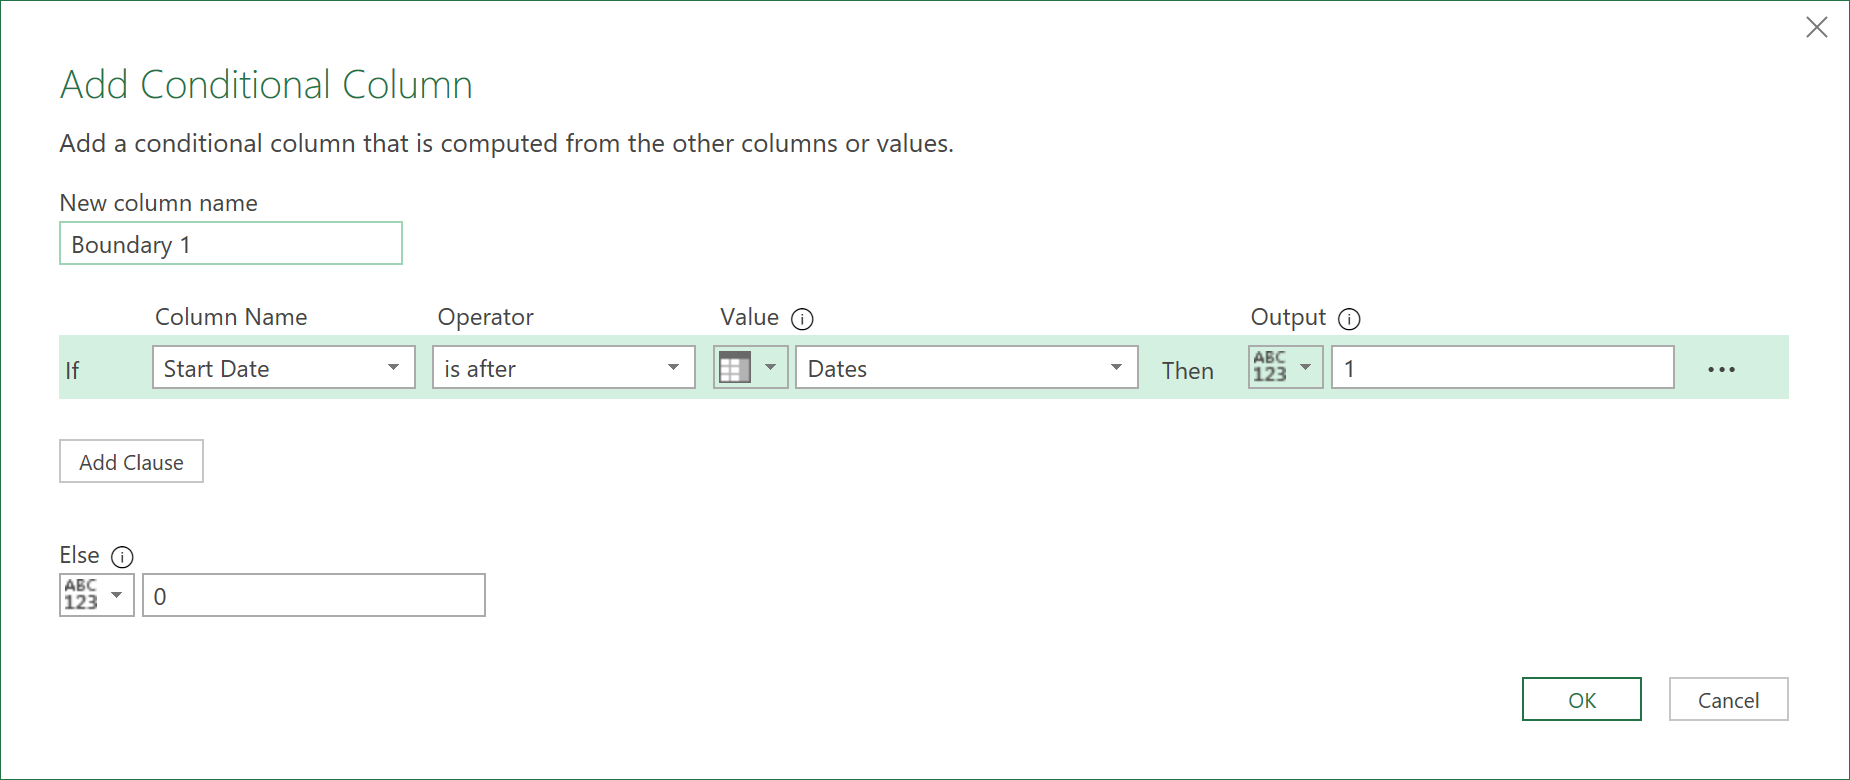
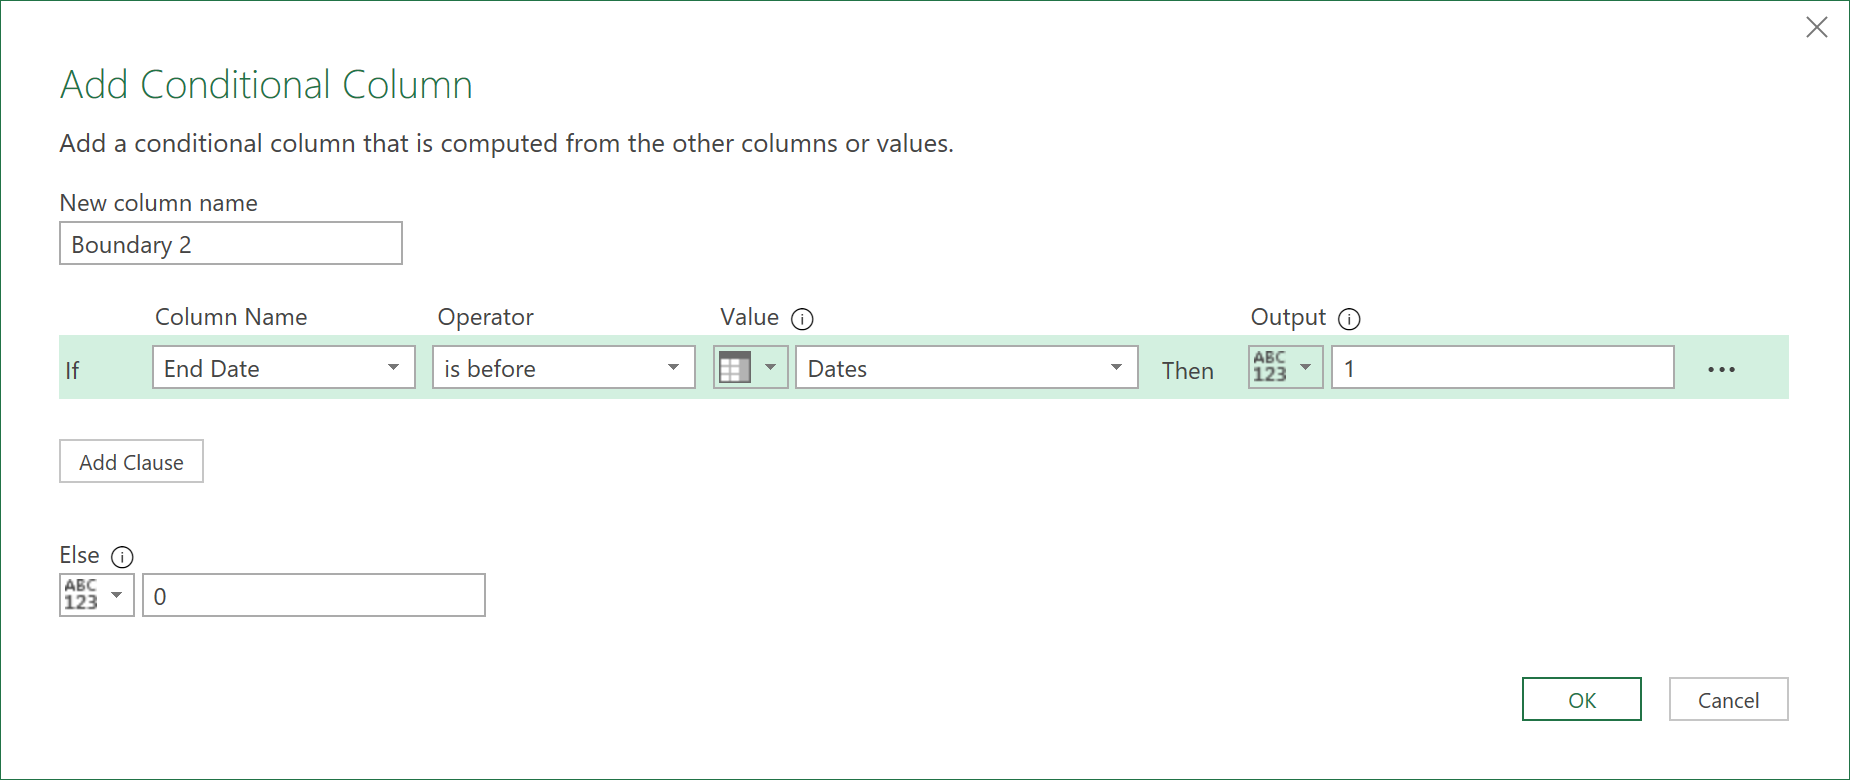
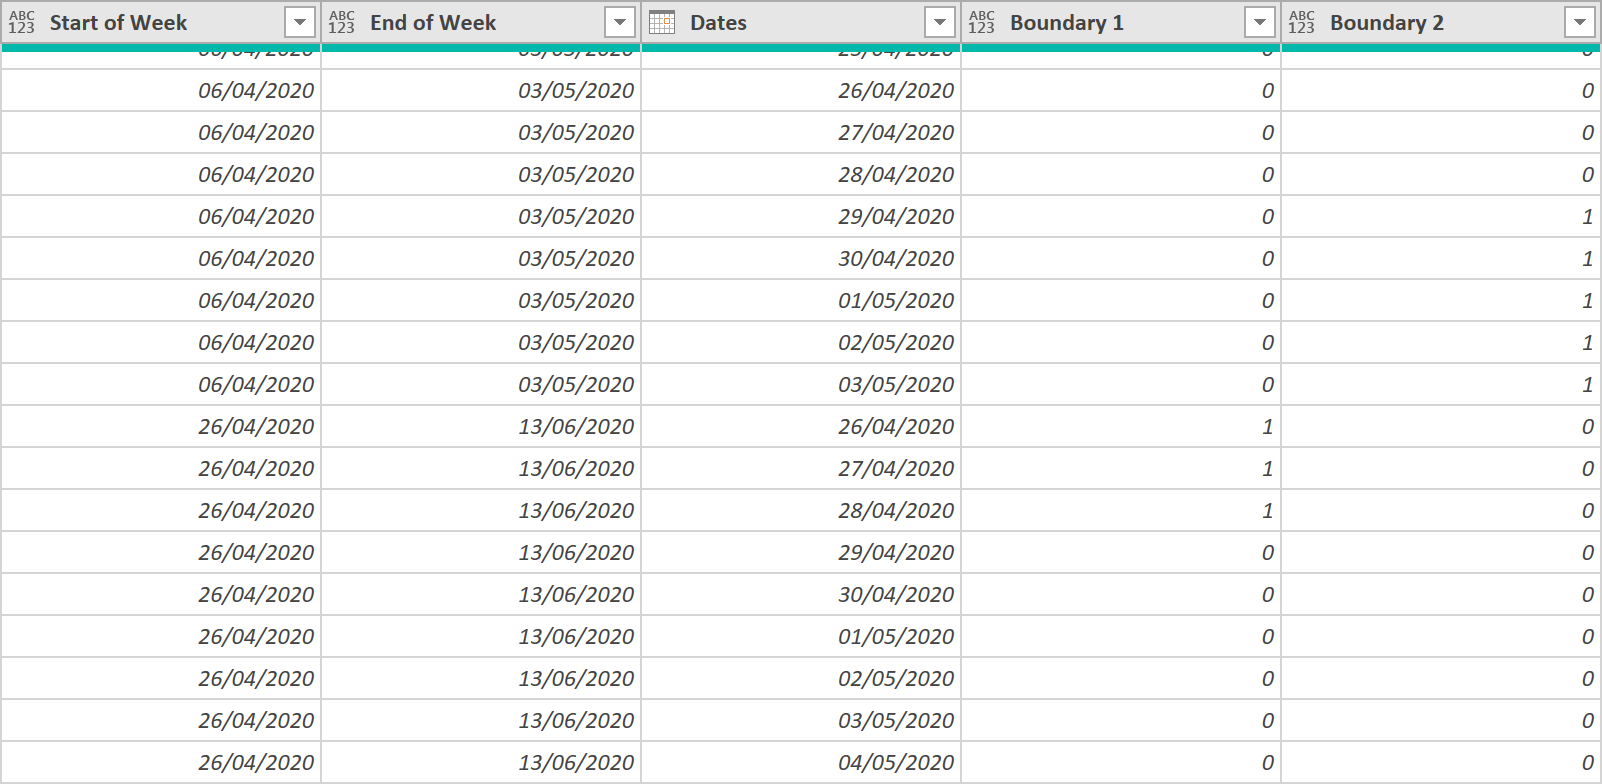
The data with these new conditional columns should now look like this:
- Now Group the data, like so by ‘User ID’ and ‘Dates’:
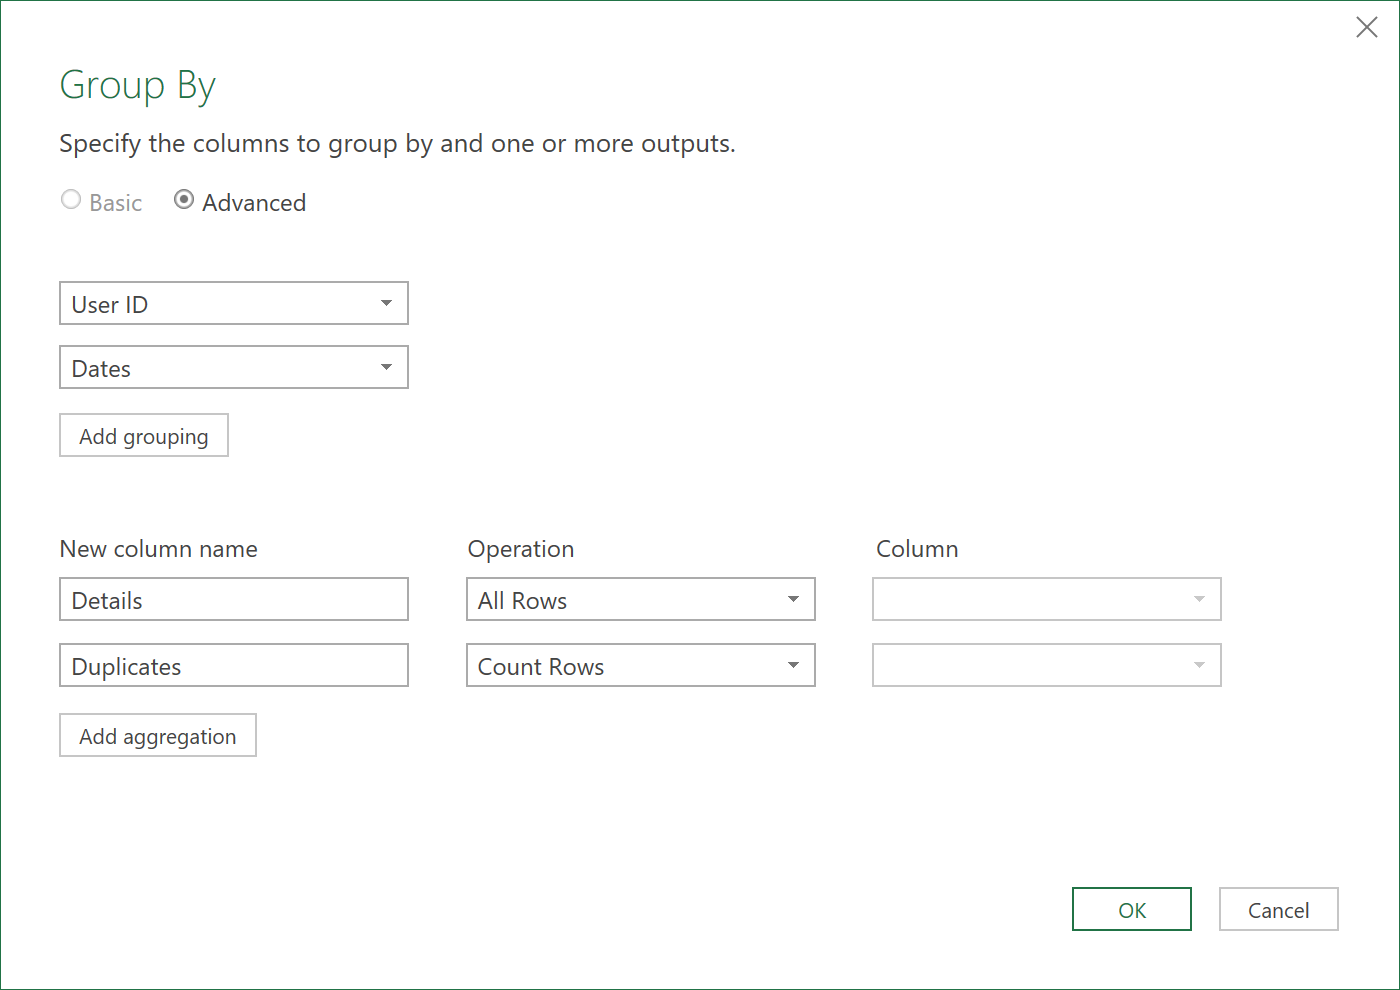
After grouping, you should see this, with a column that now shows the rows where there are duplicates (those that have the number 2 below):
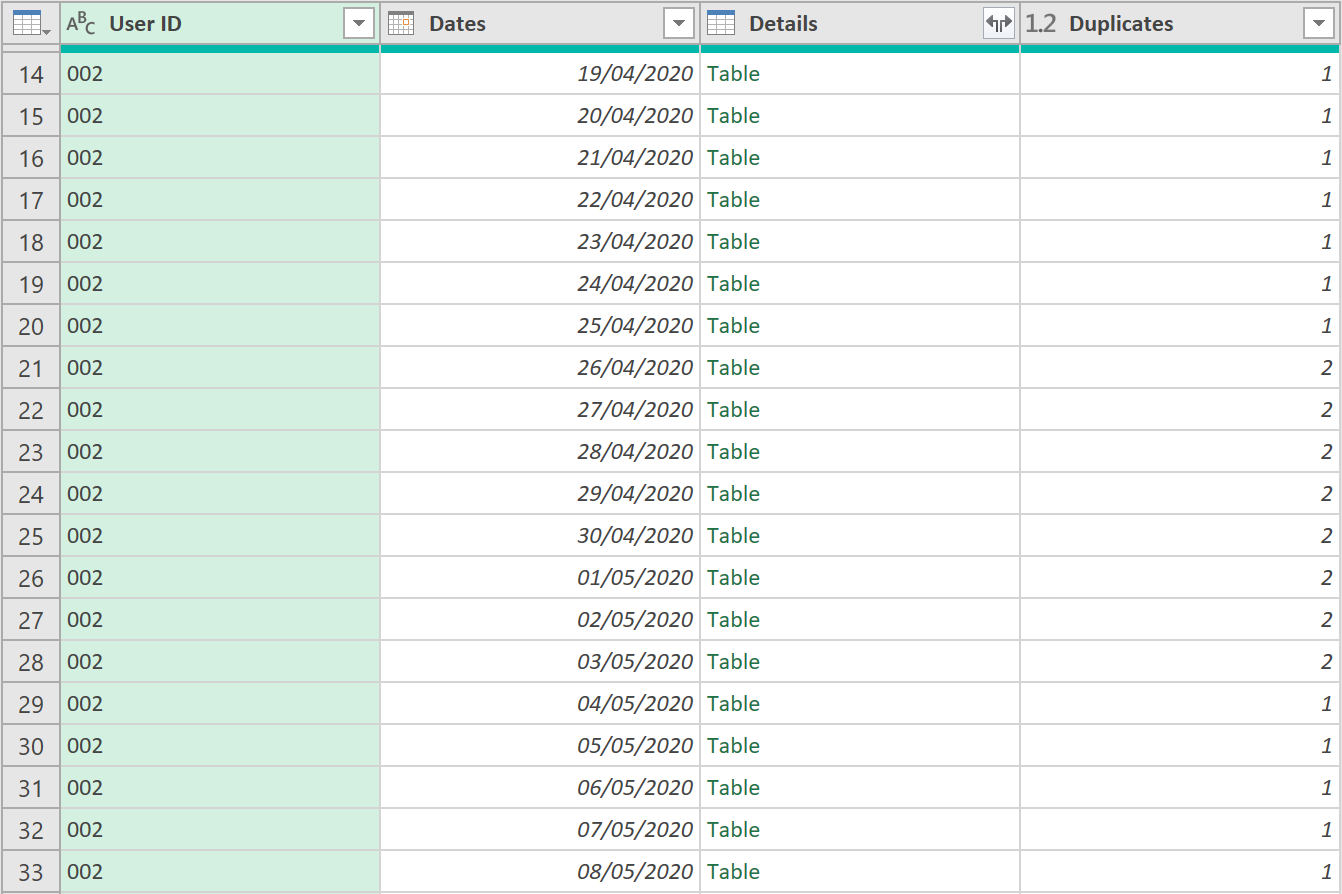
- Now, click on the ‘Details’ column, and expand all fields (excluding the ‘User ID’, and ‘Dates’, as they are already there)
The last three columns should now look like this:
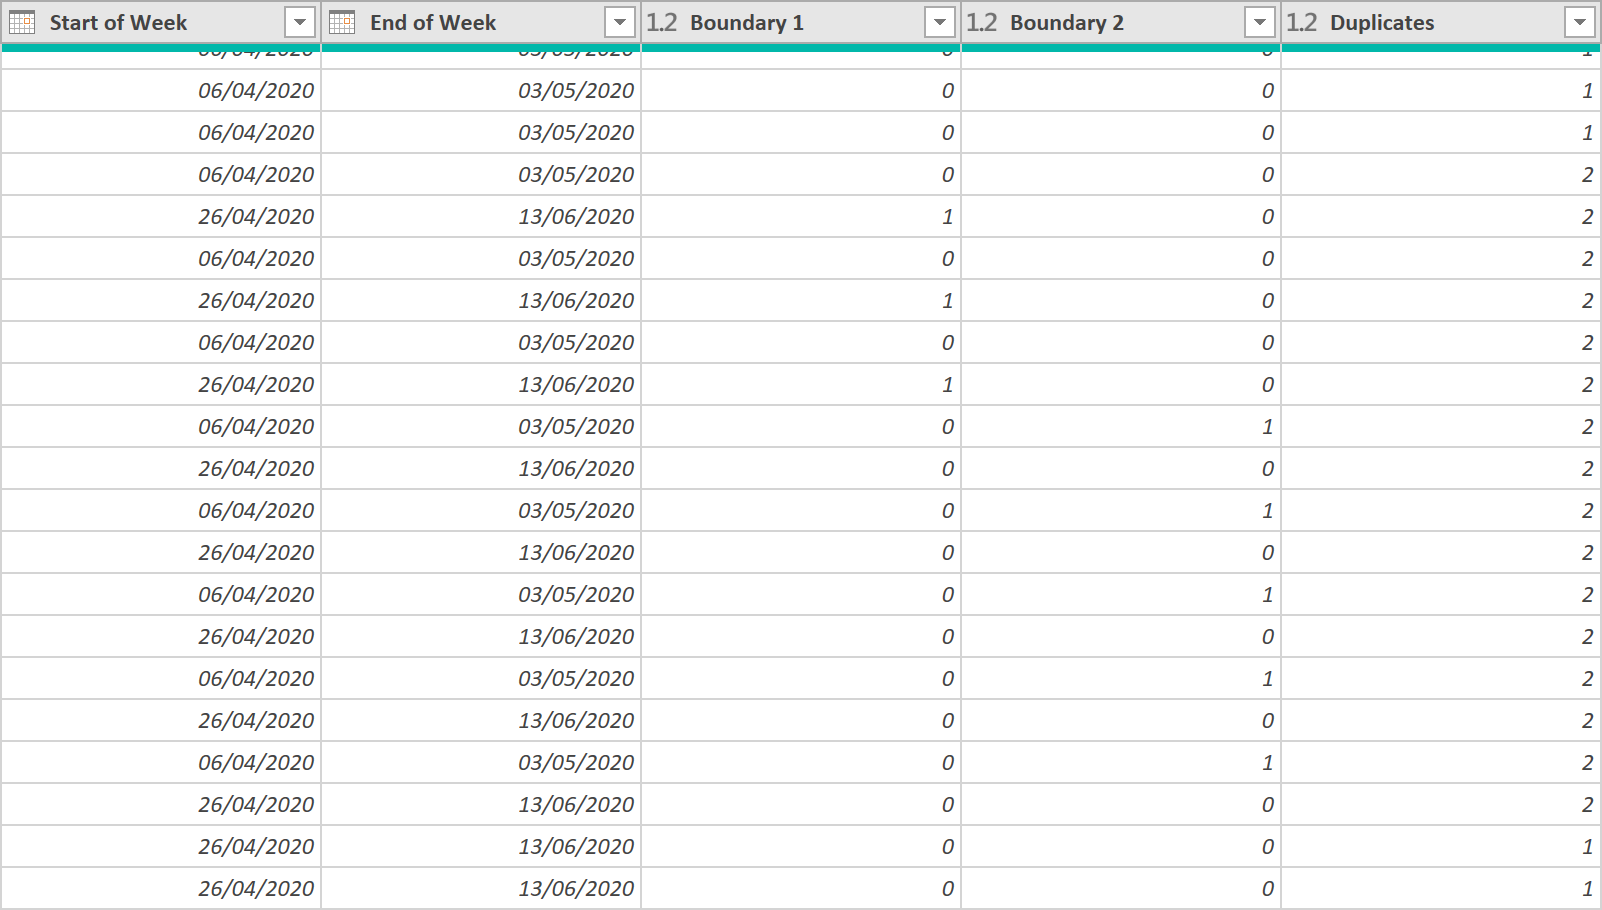
- We now have enough information, to know which columns to remove. So, next, add the following binary custom column:
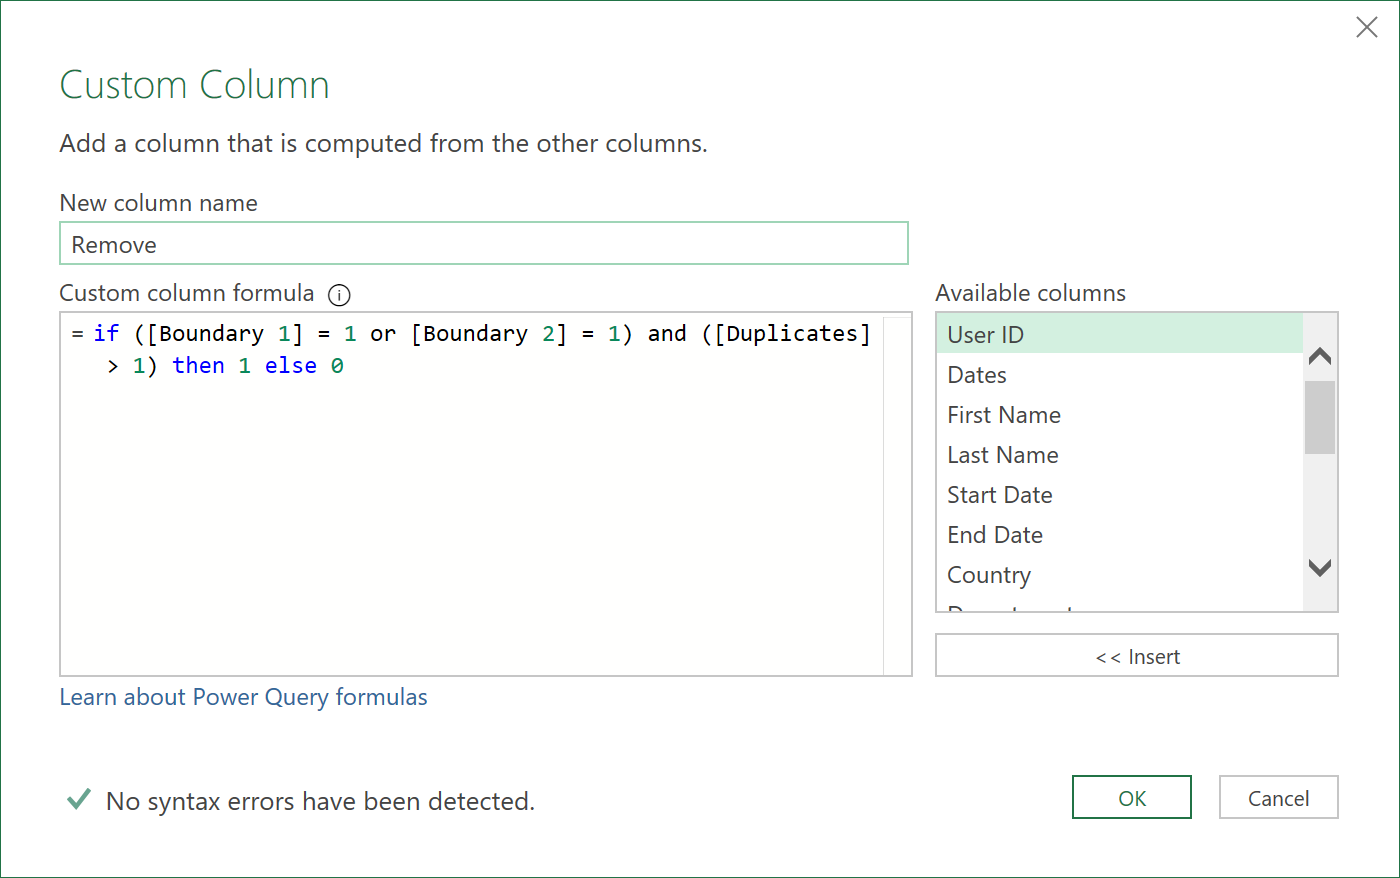
The data in the last few columns should look like this:
- Filter out any duplicate rows, by applying a filter to the ‘Remove’ column. The ‘M’ code, for this is shown below. This will leave, now, only unique values, for each Employee, in the ‘Dates’ column (there should be no duplicate Dates, for each Employee).
= Table.SelectRows(#"Added Remove Duplicates", each ([Remove] = 0))
-
Now, remove the ‘Start of Week’, ‘End of Week’, ‘Boundary 1’, ‘Boundary 2’, ‘Duplicates’, and ‘Remove’ columns, as they are no longer needed
-
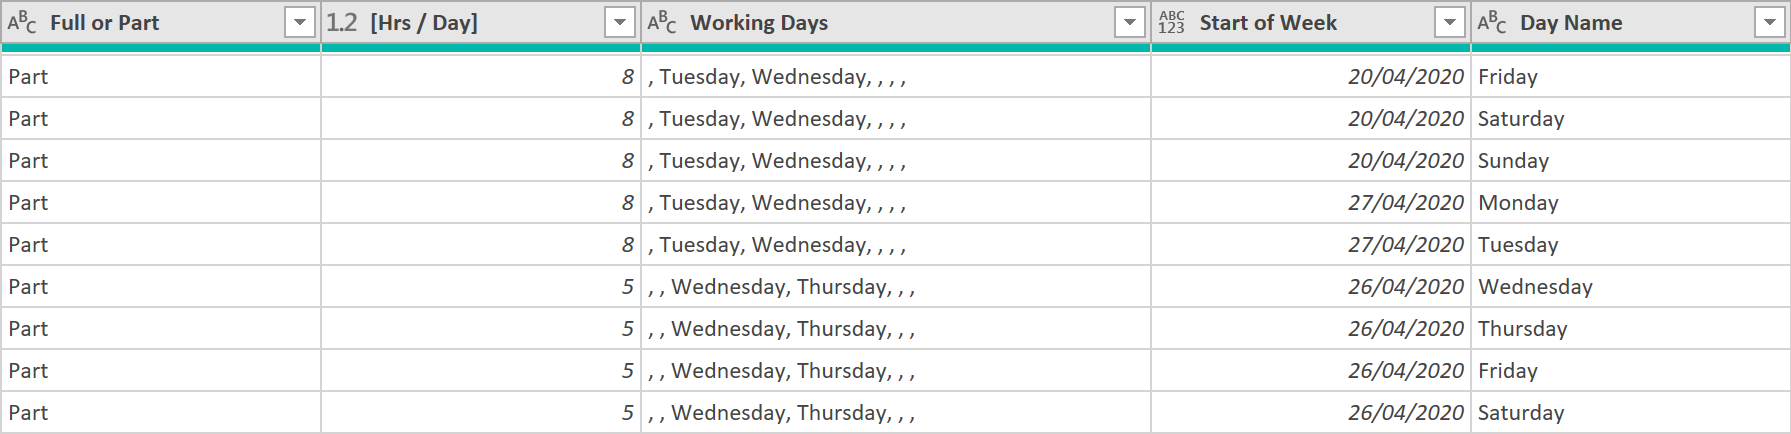
Re-add a new ‘Start of Week’ column (this time, based on the new ‘Dates’ column, rather than ‘Start Date’ column), like so, being careful with the Geographic / Location logic used:
- Now, Insert a ‘Day Name’ column
The data should finally look like this:
Show Inventory Availability by day – shortfall check (adding logic columns)
The Availability data is now in a form, where we can start to build in some extra logic, based on the date columns that were added. So basically, we continue to build on the logic with more logic!
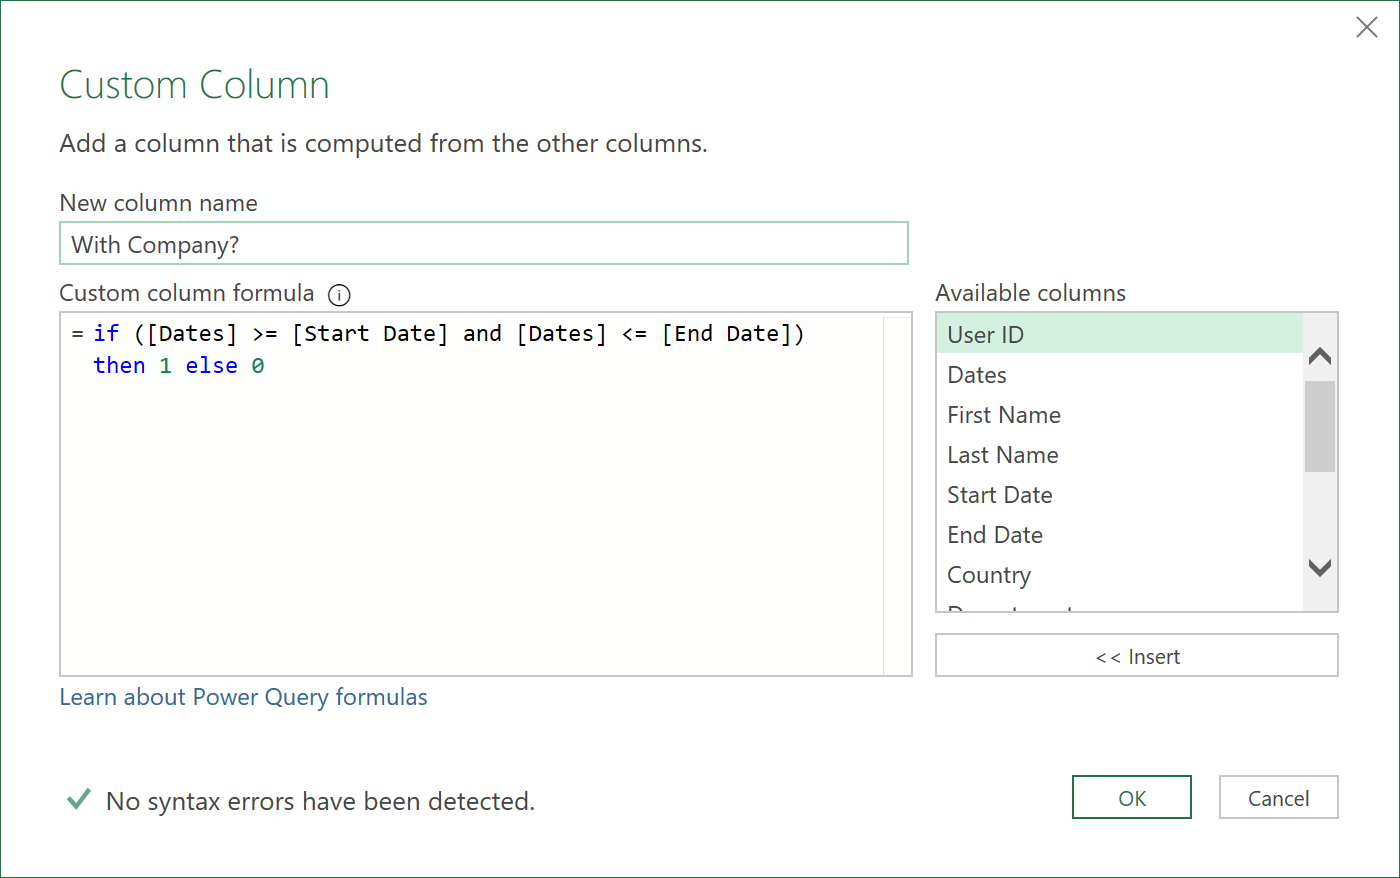
- Add a ‘With Company?’ column, like so:
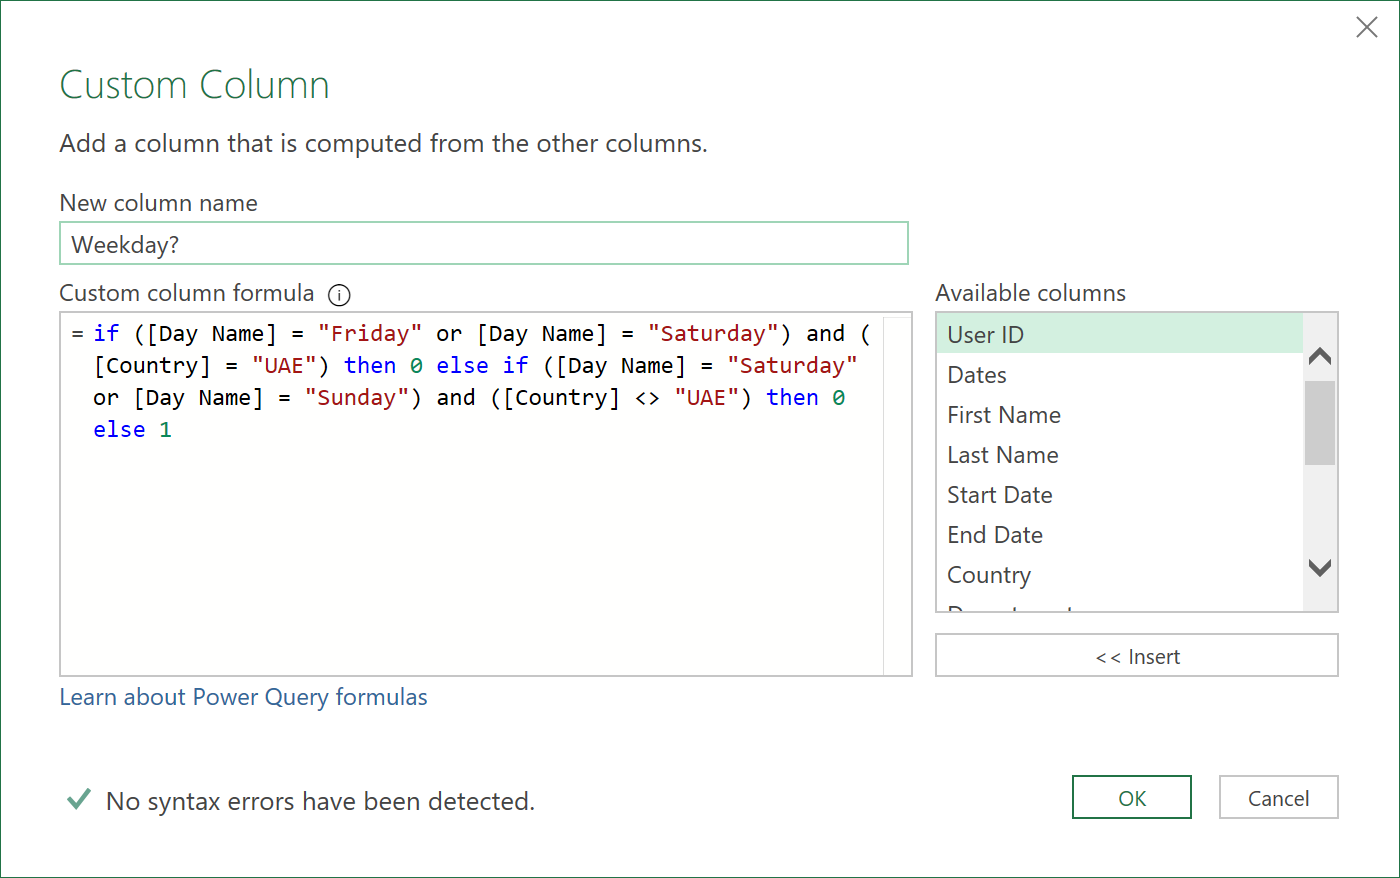
- Add a ‘Weekday’ column
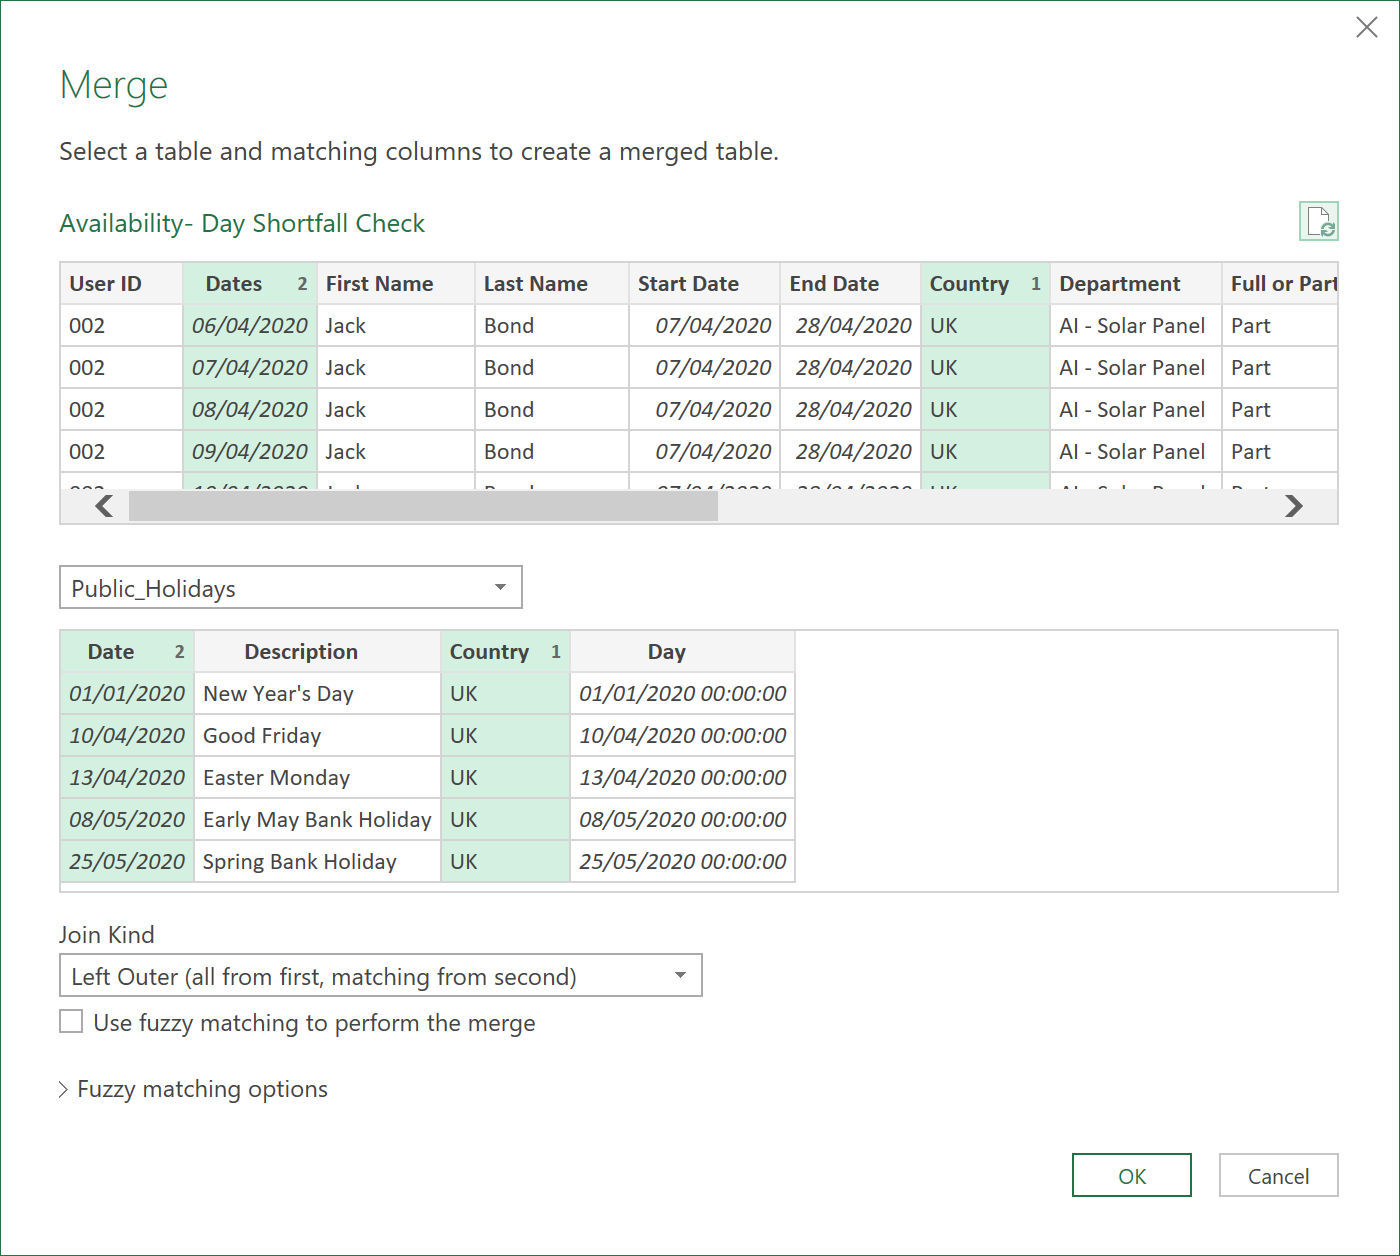
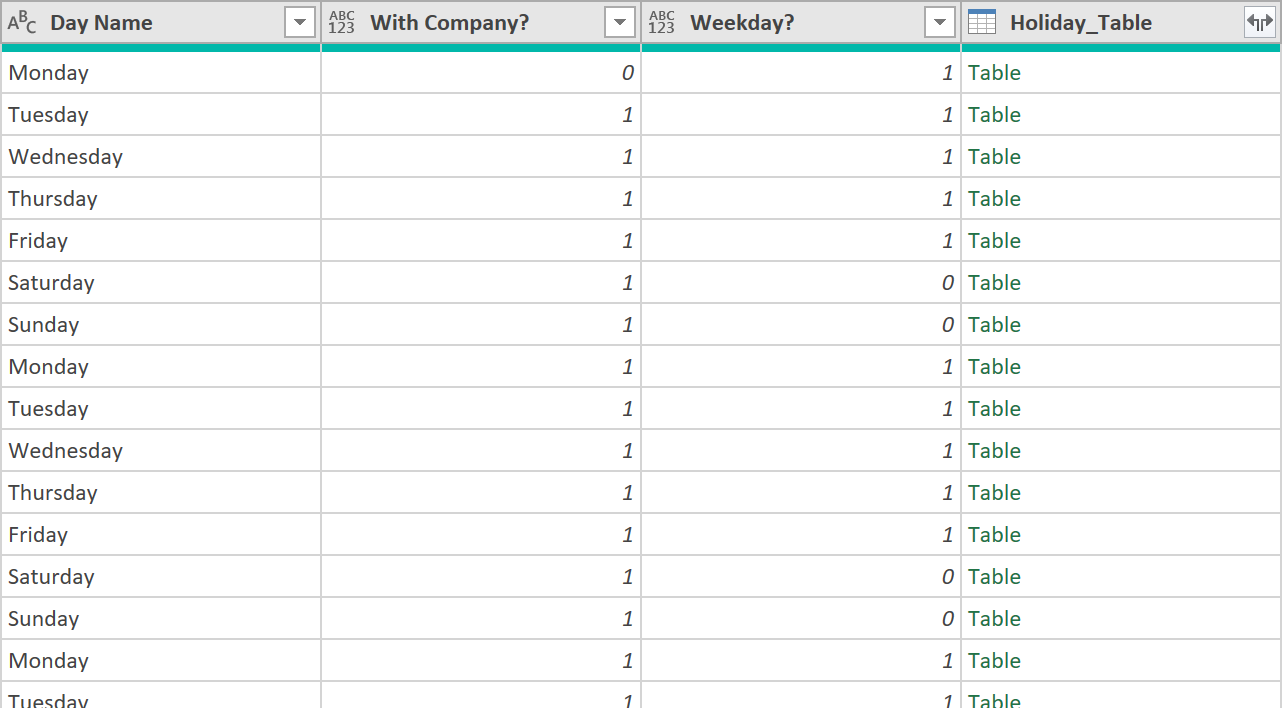
- Add a ‘Public Holiday’ column by merging the query with the Holiday Data (one of the three datasets we had originally obtained).
After the Merge, a new column will be added, with table objects added to each row.
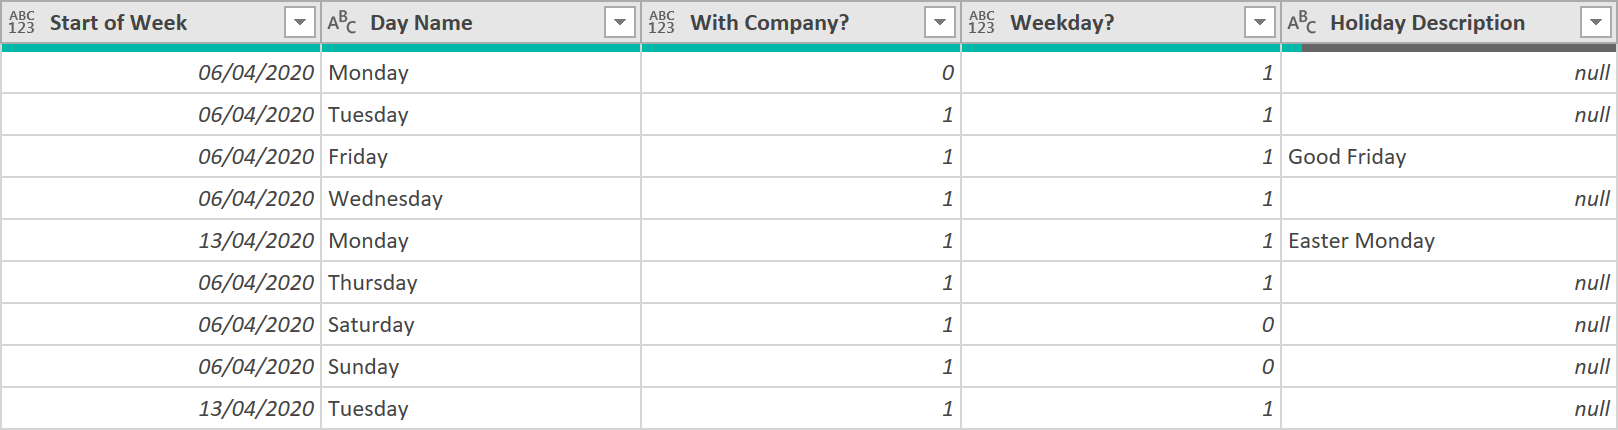
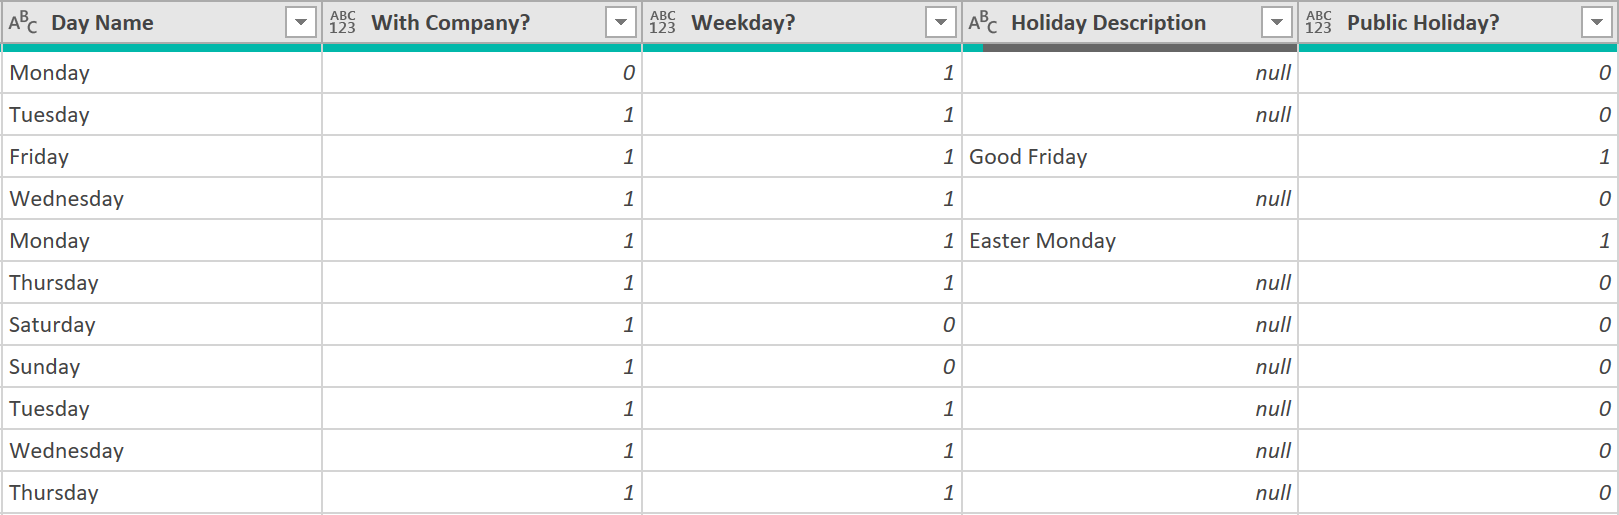
- Expand only the ‘Holiday Description’ field, from each table object.
- Next, add a ‘Binary’ logic column for Public Holidays
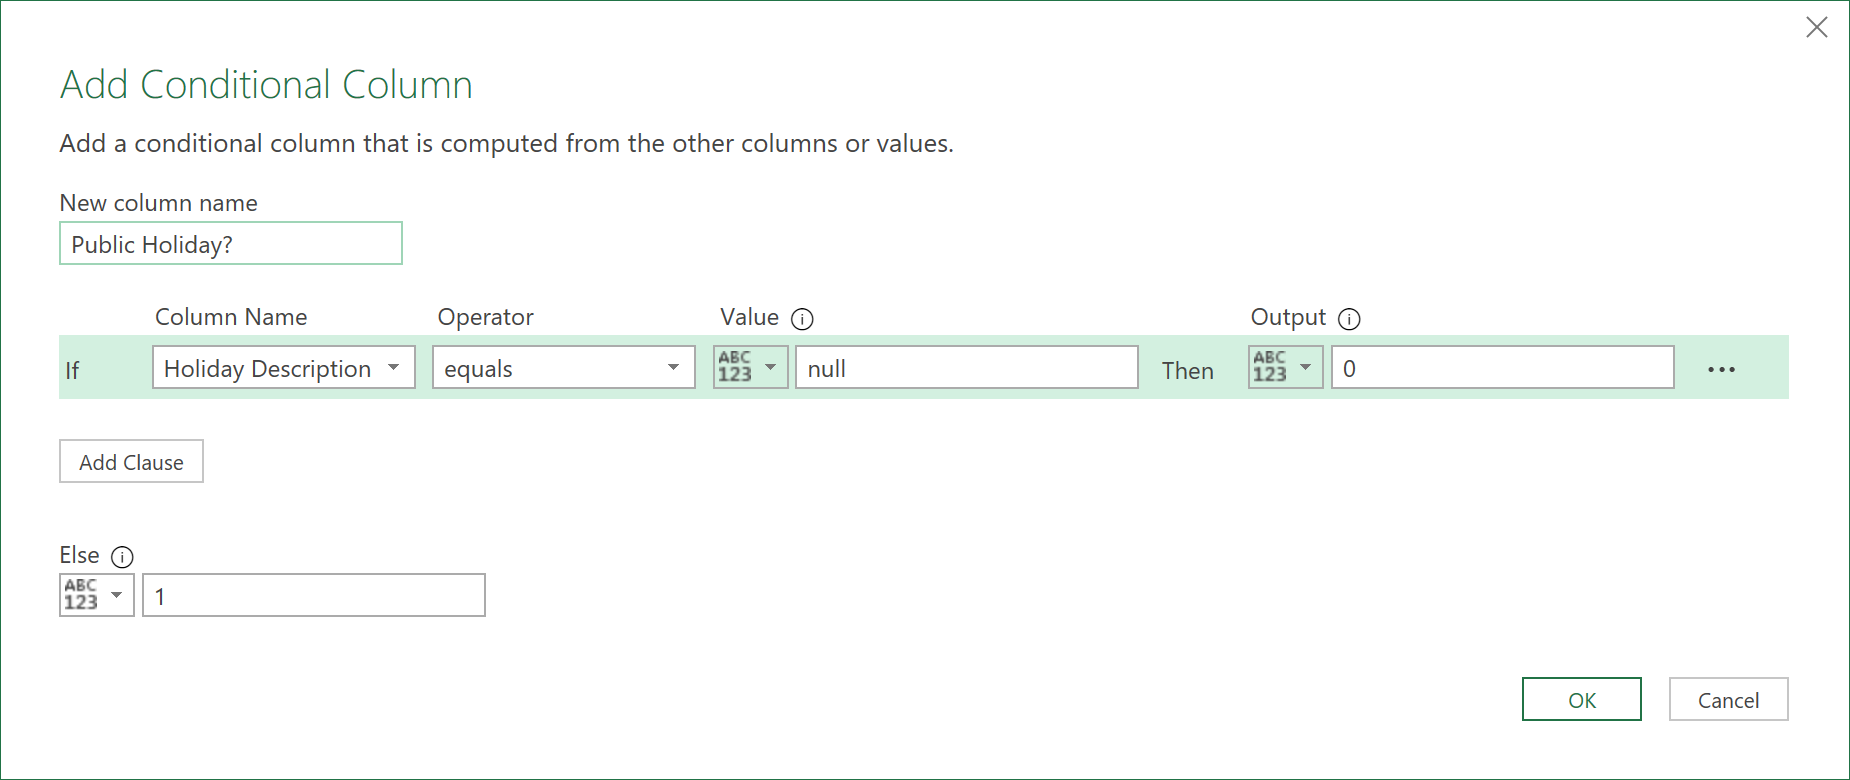
This will allow us to perform further follow on calculations, on this field.
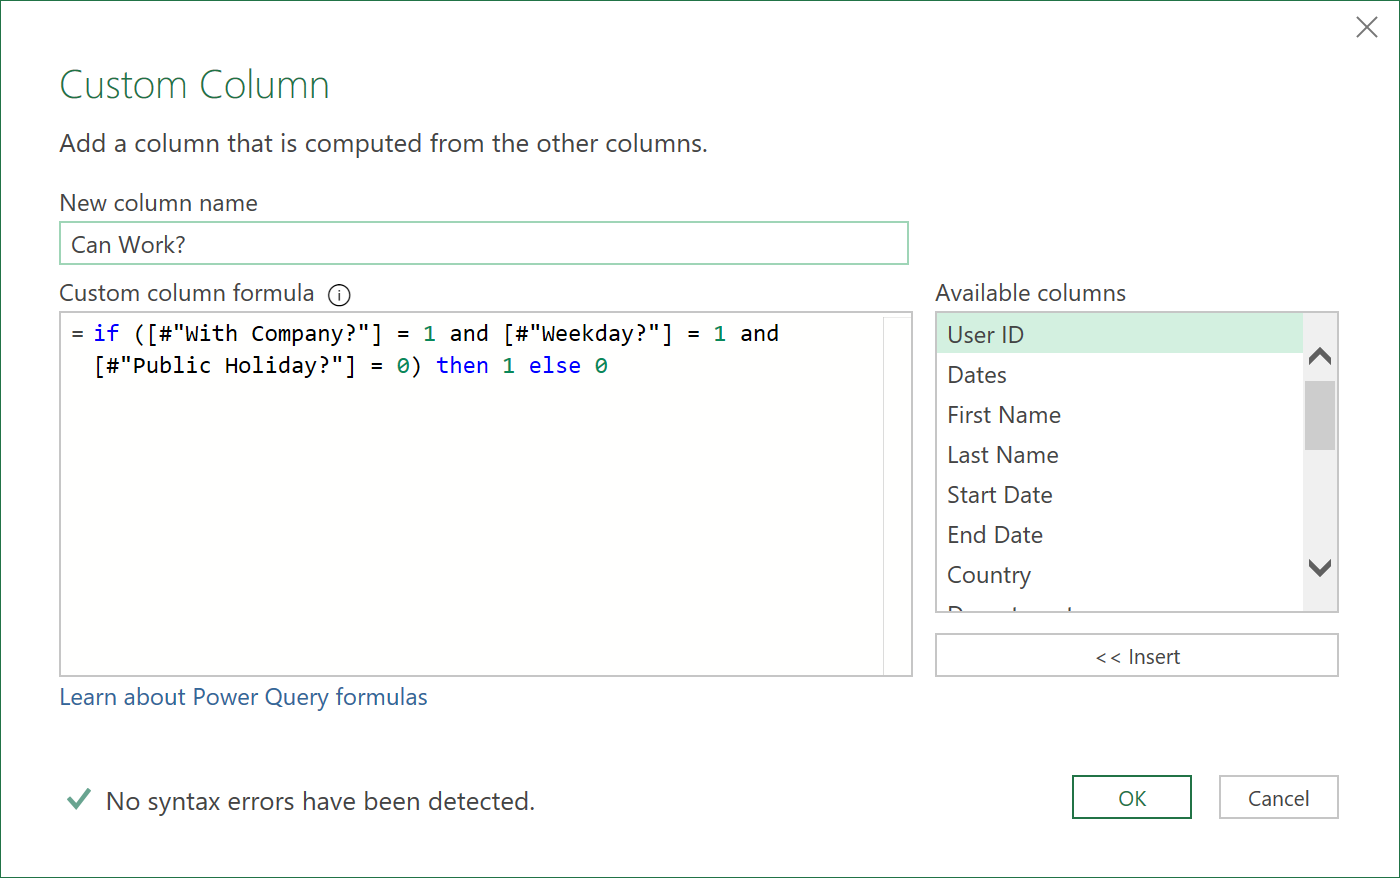
- Now, add a ‘Can Work?’ column
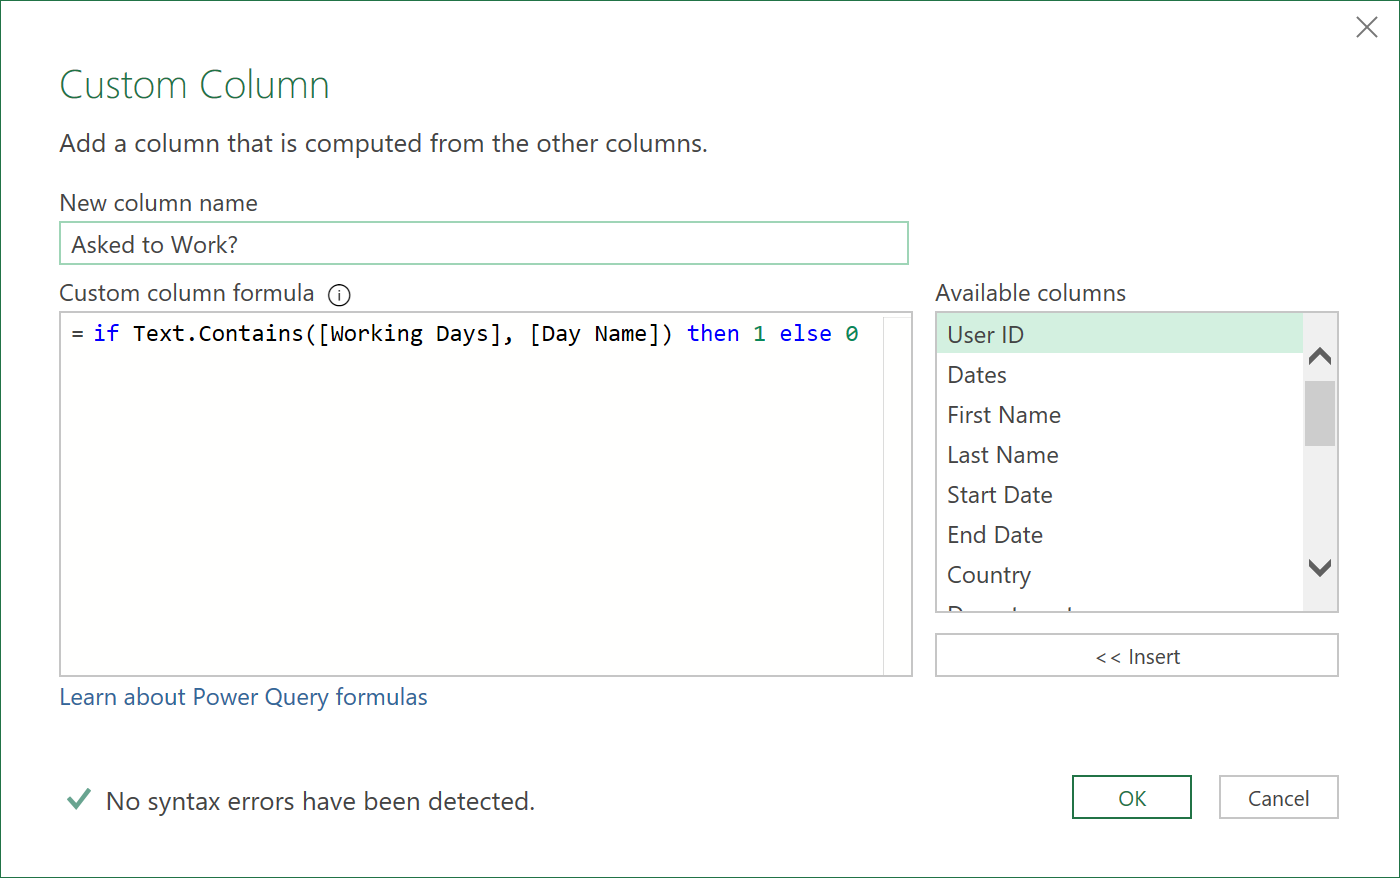
- Add an ‘Asked to Work?’ column
- Add an ‘Able to Work?’ column
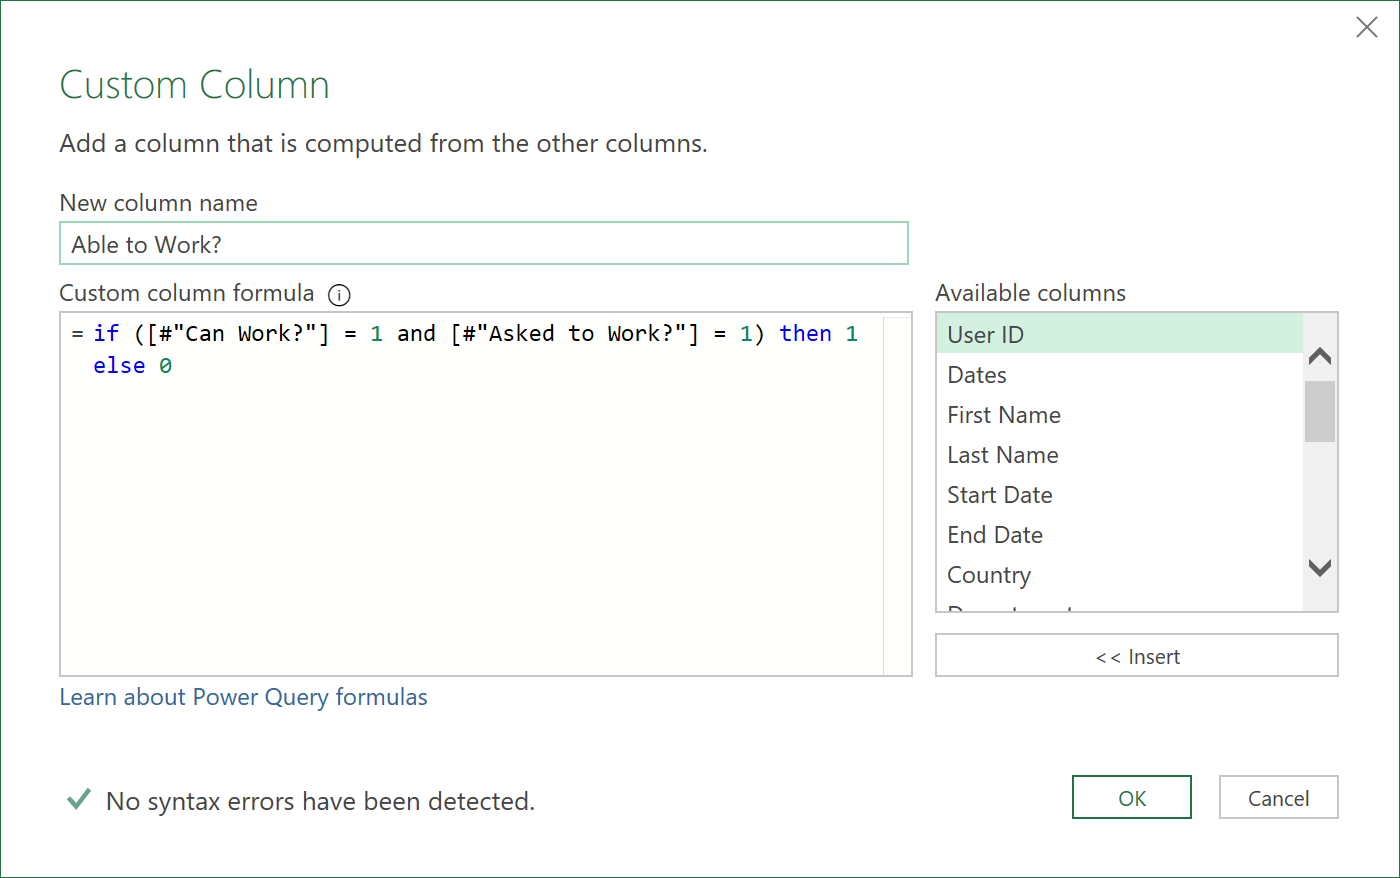
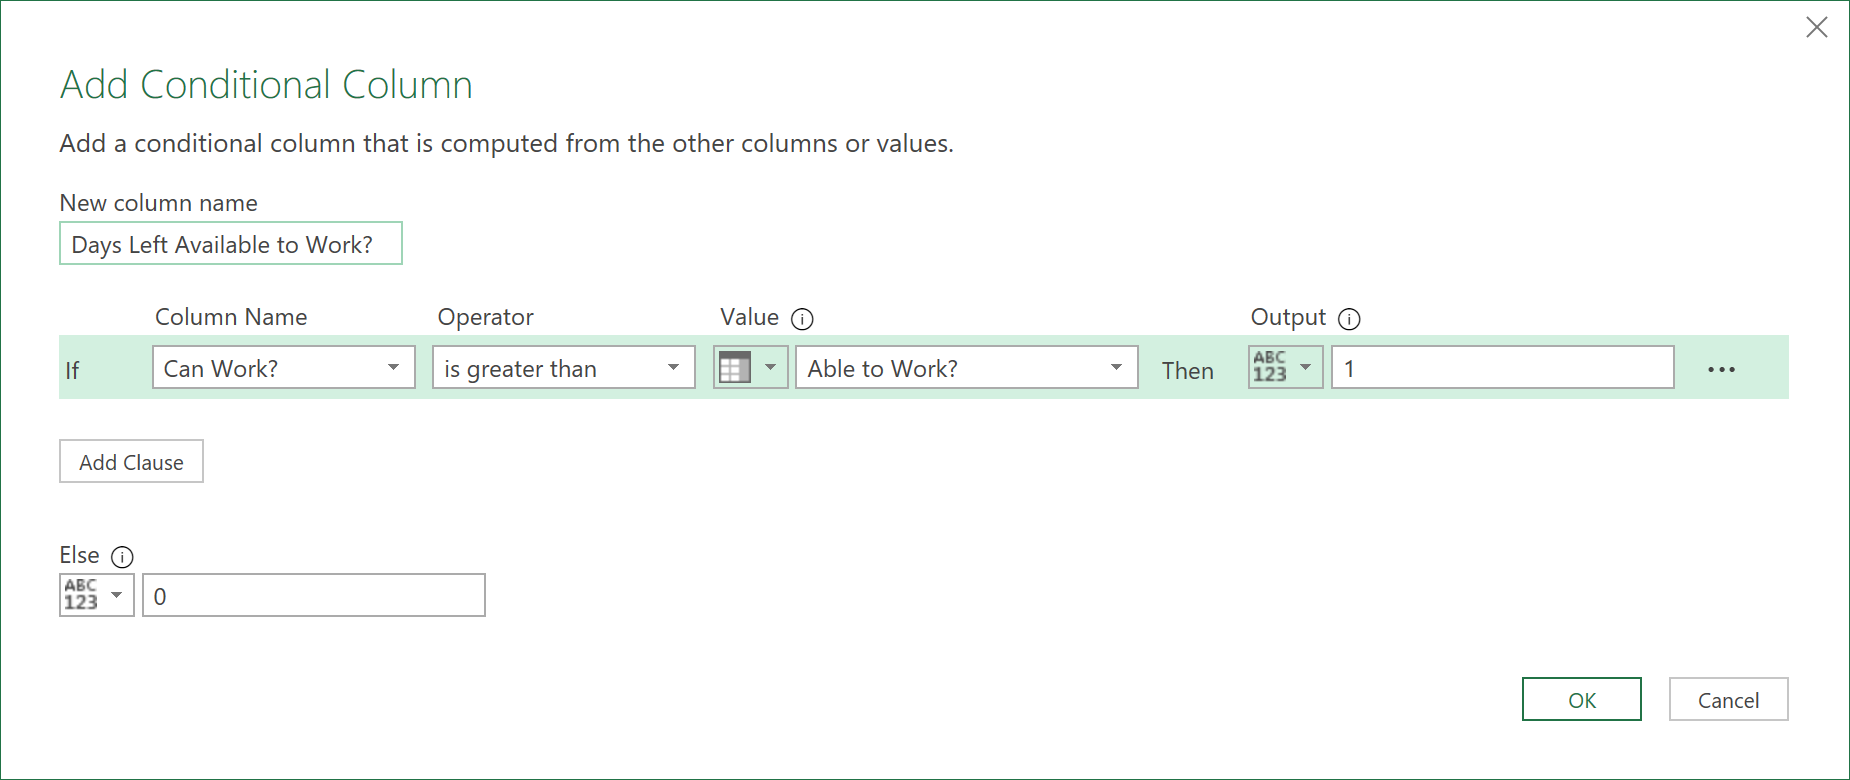
- Add a ‘Days Left Available to Work?” column (days the Employee could have worked but did not because they did not ask to work on those days - relevant for Part Time Employees)
- Now, group the data by ‘Start of Week’, ‘User ID’, and ‘Country’, (but not ‘Department’), as for now we can assume that in a given week, an Employee can move from Department to Department quite easily, in the same country. Thus, in a given week, if the Employee works part time, their available hours can be re-allocated to another day (a different department is permissible), e.g. due to their preferred working day falling on a Public or Company Holiday.
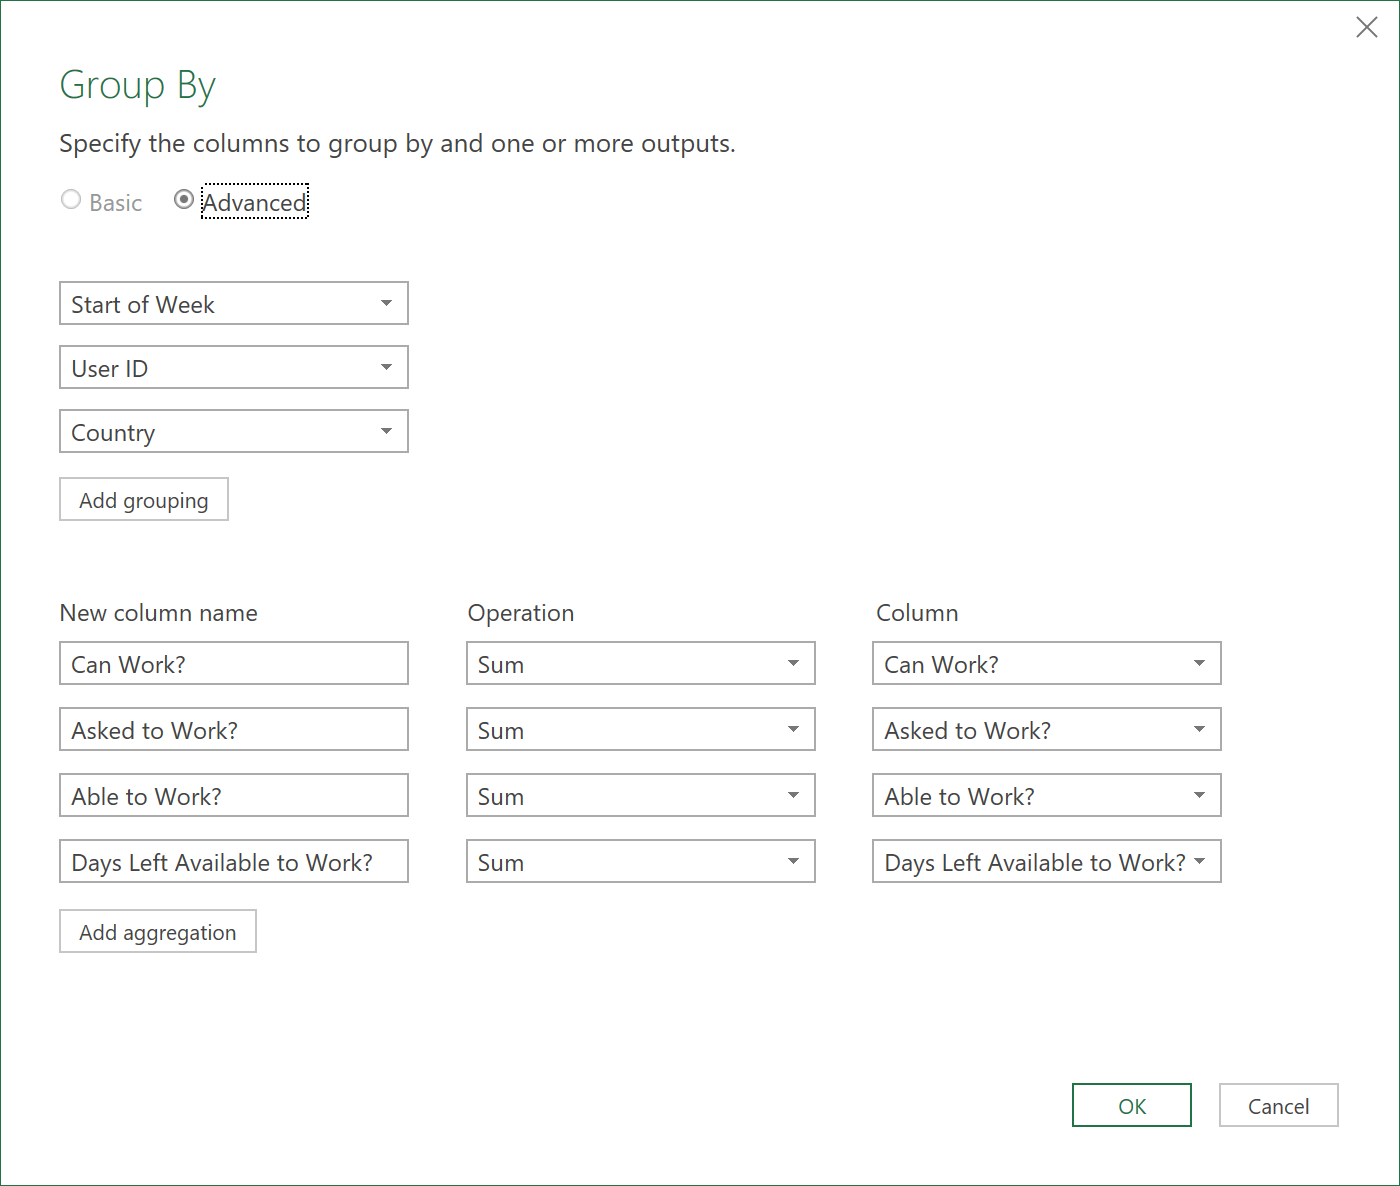
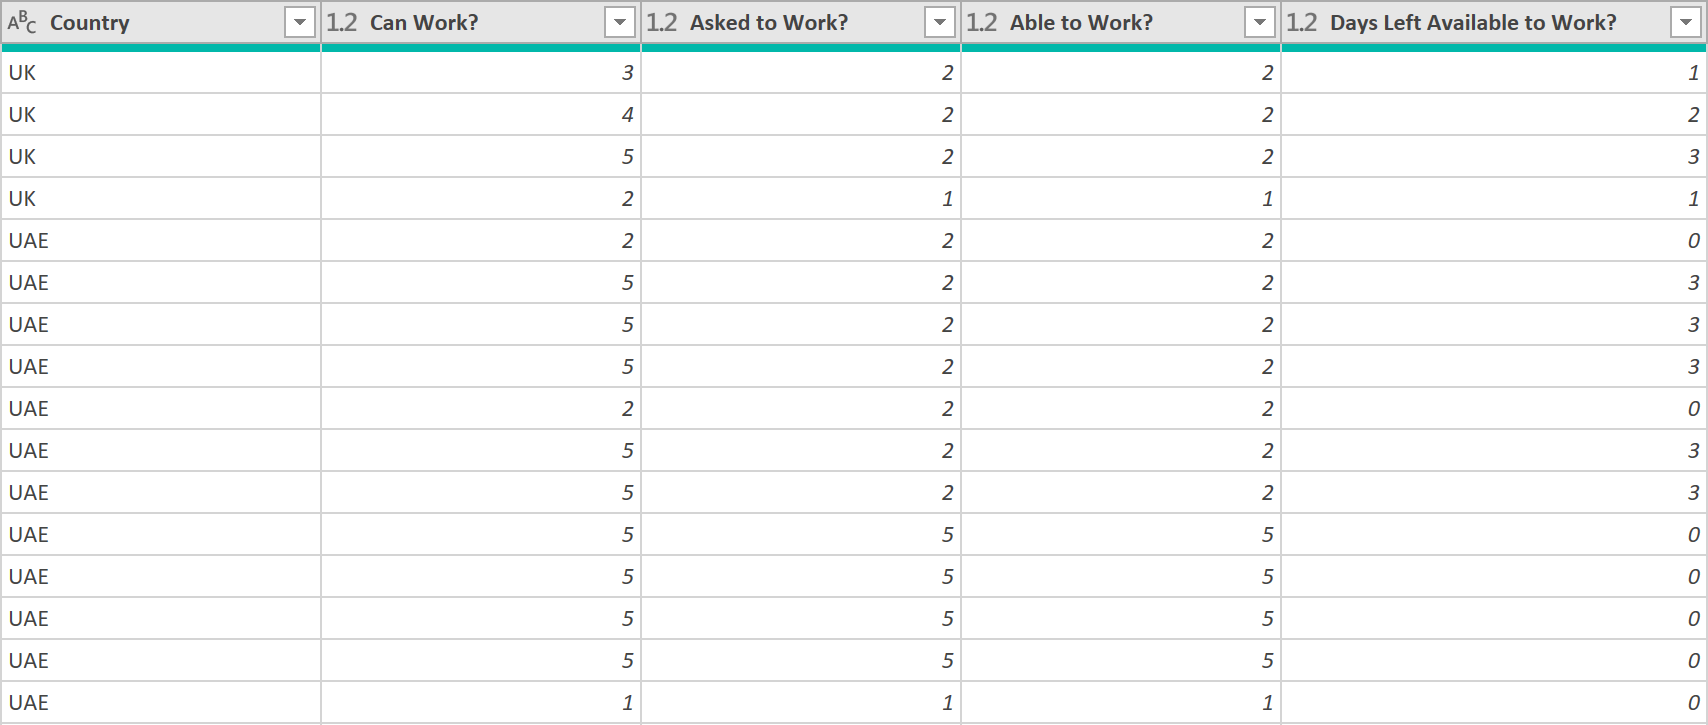
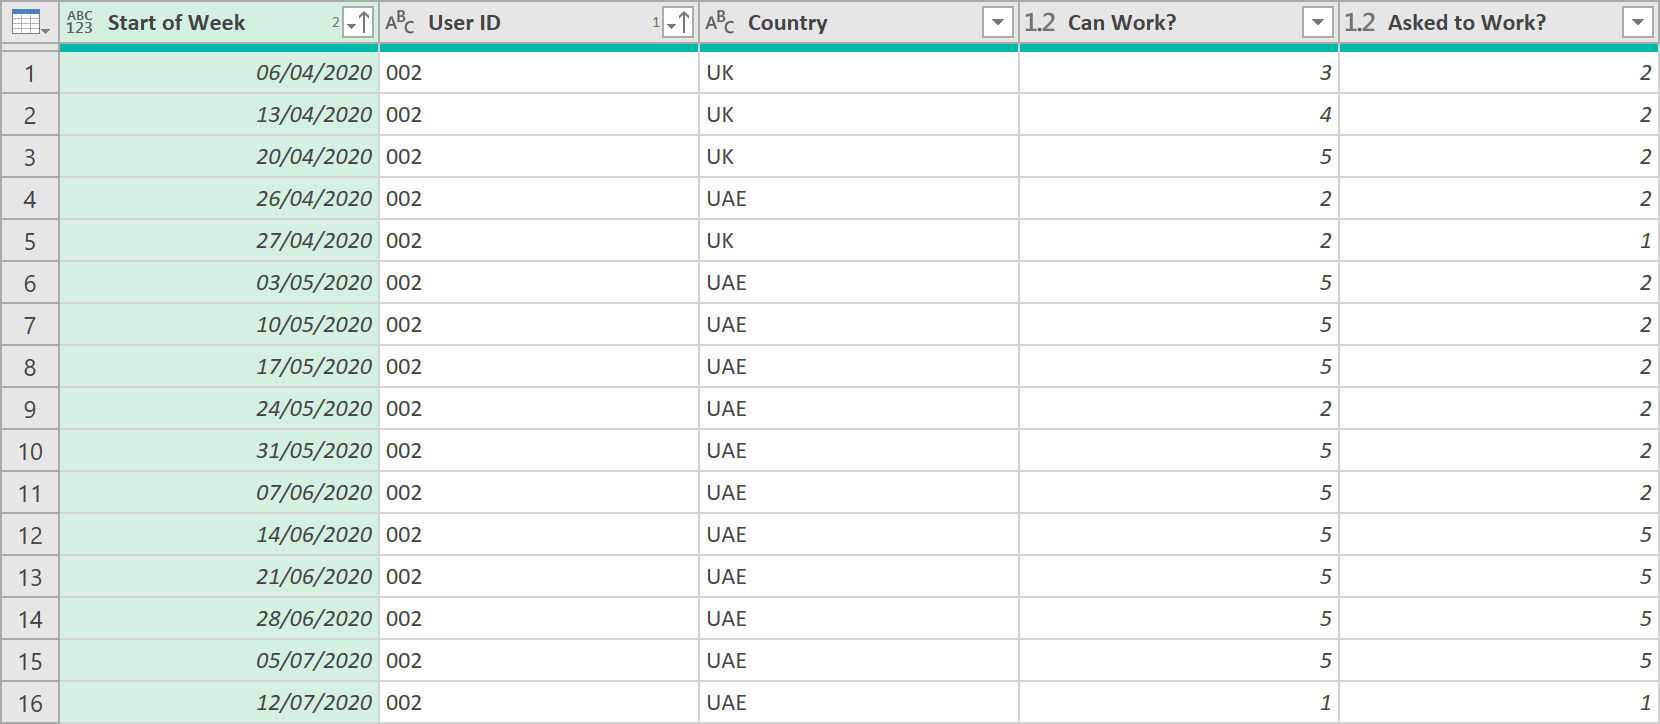
After the grouping operation, the data should look like this:
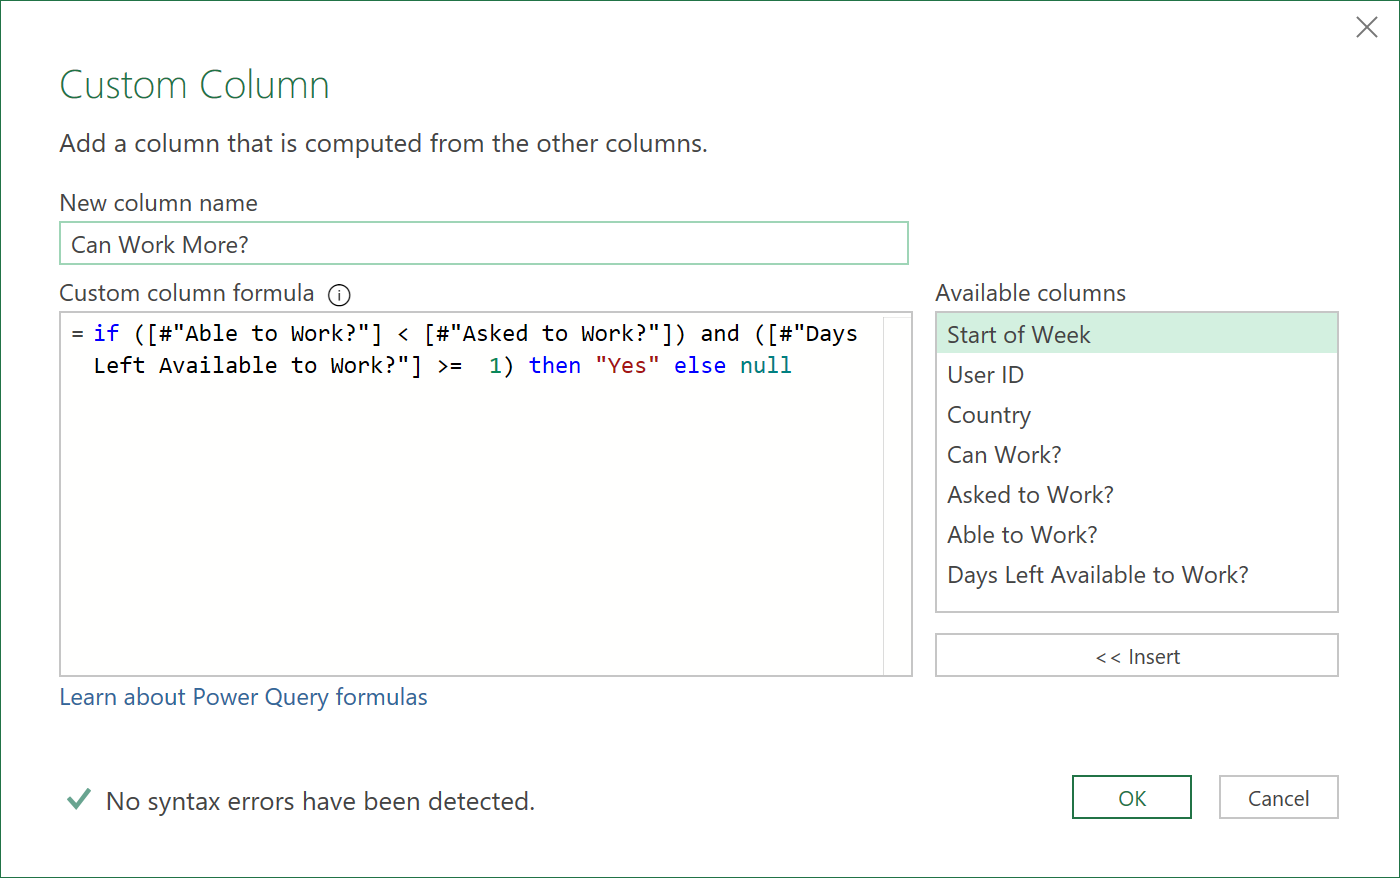
- Now, add a ‘Can Work More?’ column. In case a part time Employee asked to work certain days in a week, but on those days could not (e.g. due to a Public Holidays), and if there are still days left available to work, it means the Employee can work on alternative days in the week, to fulfil their weekly promised quota.
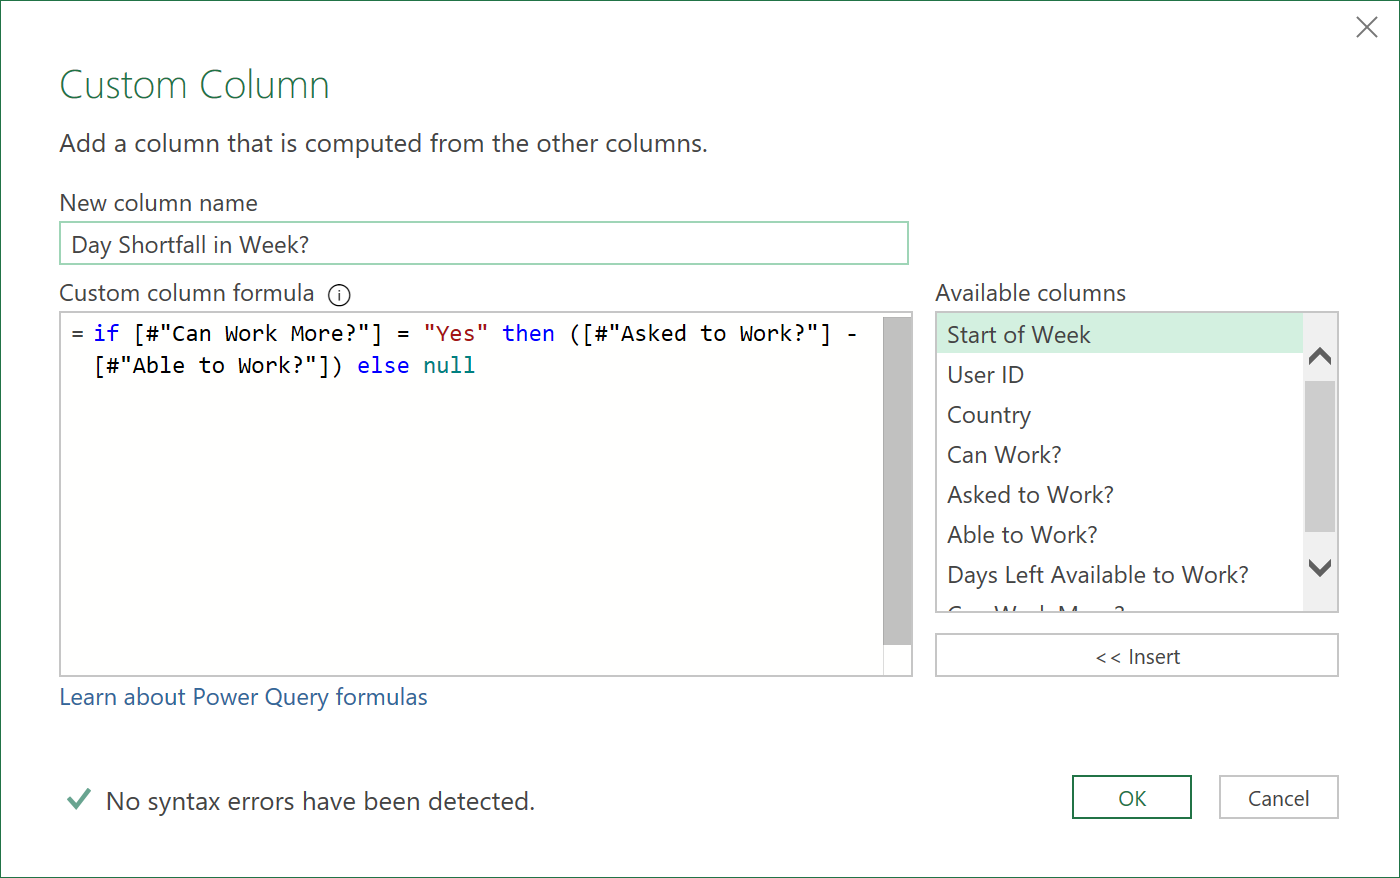
- Next, add a ‘Day Shortfall in Week?’ column to record the number days a part-time Employee asked to work, but was not able to.
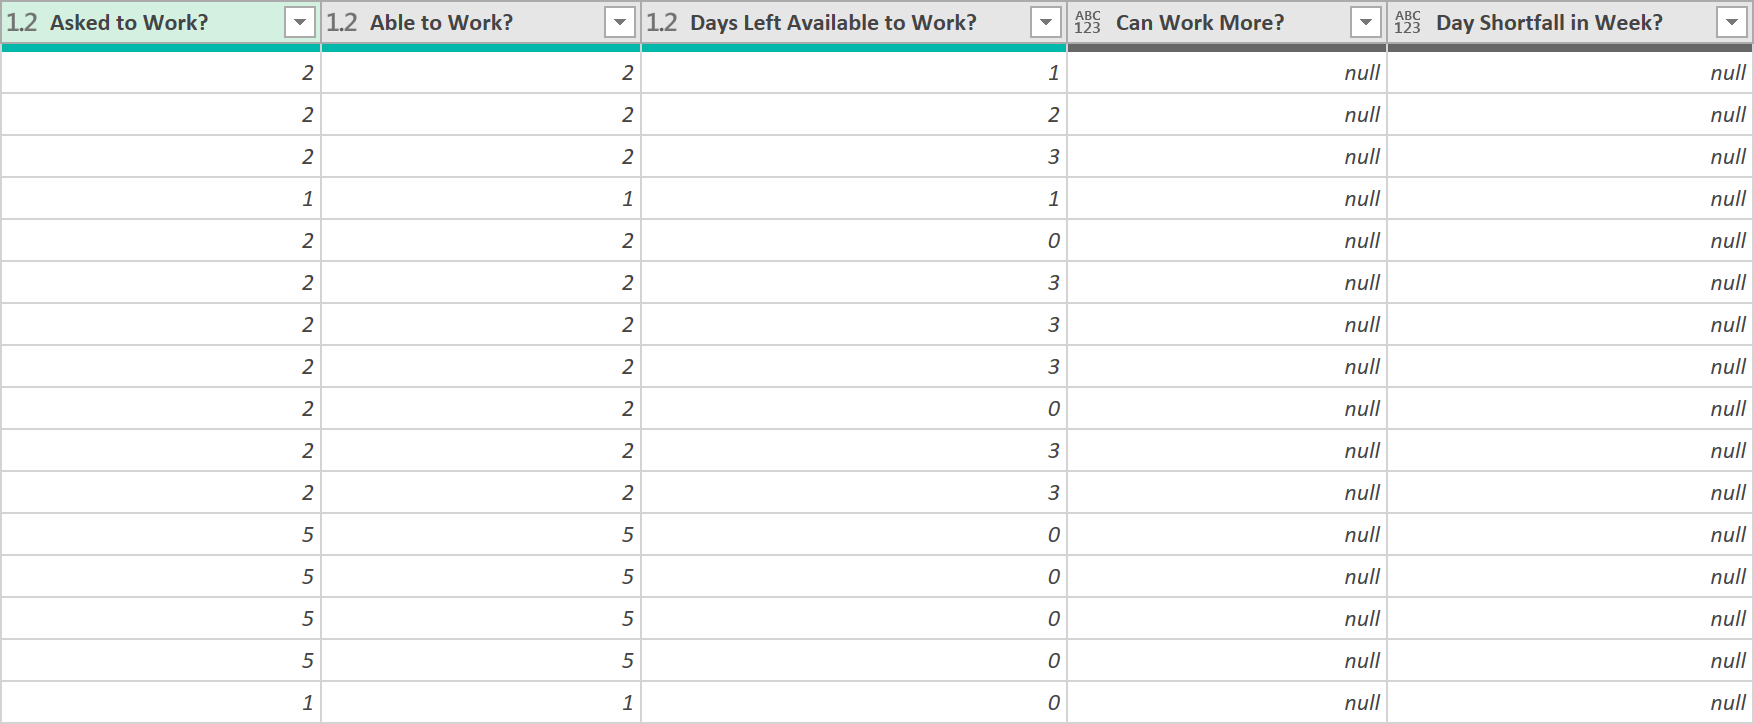
The data, once added should look like this – note the two extra columns, now, at the end:
- Finally, sort the data by ‘User ID’, and then ‘Start of Week’
- Call the query ‘Availability- Day Shortfall Check’
The final ‘ETL’ code for this query should look something like this:
let
    Source = Inventory_Availability_SCD,
    #"Fill in End Dates" = Table.ReplaceValue(Source,null, Max_Date,Replacer.ReplaceValue,{"End Date"}),
    Monday = Table.ReplaceValue(#"Fill in End Dates","Yes","Monday",Replacer.ReplaceText,{"Mon"}),
    Tuesday = Table.ReplaceValue(Monday,"Yes","Tuesday",Replacer.ReplaceText,{"Tue"}),
    Wednesday = Table.ReplaceValue(Tuesday,"Yes","Wednesday",Replacer.ReplaceText,{"Wed"}),
    Thursday = Table.ReplaceValue(Wednesday,"Yes","Thursday",Replacer.ReplaceText,{"Thu"}),
    Friday = Table.ReplaceValue(Thursday,"Yes","Friday",Replacer.ReplaceText,{"Fri"}),
    Saturday = Table.ReplaceValue(Friday,"Yes","Saturday",Replacer.ReplaceText,{"Sat"}),
    Sunday = Table.ReplaceValue(Saturday,"Yes","Sunday",Replacer.ReplaceText,{"Sun"}),
    #"Merged Columns" = Table.CombineColumns(Sunday,{"Mon", "Tue", "Wed", "Thu", "Fri", "Sat", "Sun"},Combiner.CombineTextByDelimiter(", ", QuoteStyle.None),"Merged Days"),
    #"Added Working Days" = Table.AddColumn(#"Merged Columns", "Working Days", each if ([Full or Part] = "Full" and [Country] <> "UAE") then "Monday, Tuesday, Wednesday, Thursday, Friday" else if ([Full or Part] = "Full" and [Country] = "UAE") then "Monday, Tuesday, Wednesday, Thursday, Sunday" else [Merged Days]),
    #"Removed Columns" = Table.RemoveColumns(#"Added Working Days",{"Merged Days"}),
    #"Inserted Start of Week" = Table.AddColumn(#"Removed Columns", "Start of Week", each if ([Country] = "UAE") then Date.StartOfWeek([Start Date], Day.Sunday) else Date.StartOfWeek([Start Date], Day.Monday)),
    #"Inserted End of Week" = Table.AddColumn(#"Inserted Start of Week", "End of Week", each if ([Country] = "UAE") then Date.EndOfWeek([End Date], Day.Sunday) else Date.EndOfWeek([End Date], Day.Monday)),
    #"Added Custom" = Table.AddColumn(#"Inserted End of Week", "Dates", each { Number.From([Start of Week])..Number.From([End of Week]) }),
    #"Expanded Dates" = Table.ExpandListColumn(#"Added Custom", "Dates"),
    #"Changed Type" = Table.TransformColumnTypes(#"Expanded Dates",{{"Dates", type date}}),
    #"Filtered Dates" = Table.SelectRows(#"Changed Type", each [Dates] >= Min_Date and [Dates] <= Max_Date),
    #"Added Date Boundary 1" = Table.AddColumn(#"Filtered Dates", "Boundary 1", each if [Start Date] > [Dates] then 1 else 0),
    #"Added Date Boundary 2" = Table.AddColumn(#"Added Date Boundary 1", "Boundary 2", each if [End Date] < [Dates] then 1 else 0),
    #"Grouped Rows1" = Table.Group(#"Added Date Boundary 2", {"User ID", "Dates"}, {{"Details", each _, type table [User ID=text, First Name=text, Last Name=text, Start Date=date, End Date=date, Country=text, Department=text, Full or Part=text, #"[Hrs / Day]"=number, Working Days=text, Start of Week=date, End of Week=date, Dates=date, Boundary 1=number, Boundary 2=number]}, {"Duplicates", each Table.RowCount(_), type number}}),
    #"Expanded Details" = Table.ExpandTableColumn(#"Grouped Rows1", "Details", {"First Name", "Last Name", "Start Date", "End Date", "Country", "Department", "Full or Part", "[Hrs / Day]", "Working Days", "Start of Week", "End of Week", "Boundary 1", "Boundary 2"}, {"First Name", "Last Name", "Start Date", "End Date", "Country", "Department", "Full or Part", "[Hrs / Day]", "Working Days", "Start of Week", "End of Week", "Boundary 1", "Boundary 2"}),
    #"Added Remove Duplicates" = Table.AddColumn(#"Expanded Details", "Remove", each if ([Boundary 1] = 1 or [Boundary 2] = 1) and ([Duplicates] > 1) then 1 else 0),
    #"Filtered Duplicates Out" = Table.SelectRows(#"Added Remove Duplicates", each ([Remove] = 0)),
    #"Removed Columns1" = Table.RemoveColumns(#"Filtered Duplicates Out",{"Start of Week", "End of Week", "Boundary 1", "Boundary 2", "Duplicates", "Remove"}),
    #"Inserted Start of Week 2" = Table.AddColumn(#"Removed Columns1", "Start of Week", each if ([Country] = "UAE") then Date.StartOfWeek([Dates], Day.Sunday) else Date.StartOfWeek([Dates], Day.Monday)),
    #"Inserted Day Name" = Table.AddColumn(#"Inserted Start of Week 2", "Day Name", each Date.DayOfWeekName([Dates]), type text),
    #"Added With Company" = Table.AddColumn(#"Inserted Day Name", "With Company?", each if ([Dates] >= [Start Date] and [Dates] <= [End Date]) then 1 else 0),
    #"Added Weekday" = Table.AddColumn(#"Added With Company", "Weekday?", each if ([Day Name] = "Friday" or [Day Name] = "Saturday") and ([Country] = "UAE") then 0 else if ([Day Name] = "Saturday" or [Day Name] = "Sunday") and ([Country] <> "UAE") then 0 else 1),
    #"Merged Queries" = Table.NestedJoin(#"Added Weekday", {"Country", "Dates"}, Public_Holidays, {"Country", "Date"}, "Holiday_Table", JoinKind.LeftOuter),
    #"Expanded Holiday Description" = Table.ExpandTableColumn(#"Merged Queries", "Holiday_Table", {"Description"}, {"Holiday Description"}),
    #"Added Public Holiday" = Table.AddColumn(#"Expanded Holiday Description", "Public Holiday?", each if [Holiday Description] = null then 0 else 1),
    #"Added Can Work" = Table.AddColumn(#"Added Public Holiday", "Can Work?", each if ([#"With Company?"] = 1 and [#"Weekday?"] = 1 and [#"Public Holiday?"] = 0) then 1 else 0),
    #"Added Asked to Work" = Table.AddColumn(#"Added Can Work", "Asked to Work?", each if Text.Contains([Working Days], [Day Name]) then 1 else 0),
    #"Added Able to Work" = Table.AddColumn(#"Added Asked to Work", "Able to Work?", each if ([#"Can Work?"] = 1 and [#"Asked to Work?"] = 1) then 1 else 0),
    #"Added Days Left Available to Work" = Table.AddColumn(#"Added Able to Work", "Days Left Available to Work?", each if [#"Can Work?"] > [#"Able to Work?"] then 1 else 0),
    #"Grouped Rows" = Table.Group(#"Added Days Left Available to Work", {"Start of Week", "User ID", "Country"}, {{"Can Work?", each List.Sum([#"Can Work?"]), type number}, {"Asked to Work?", each List.Sum([#"Asked to Work?"]), type number}, {"Able to Work?", each List.Sum([#"Able to Work?"]), type number}, {"Days Left Available to Work?", each List.Sum([#"Days Left Available to Work?"]), type number}}),
    #"Added Can Work More" = Table.AddColumn(#"Grouped Rows", "Can Work More?", each if ([#"Able to Work?"] < [#"Asked to Work?"]) and ([#"Days Left Available to Work?"] >=  1) then "Yes" else null),
    #"Added Day Shortfall" = Table.AddColumn(#"Added Can Work More", "Day Shortfall in Week?", each if [#"Can Work More?"] = "Yes" then ([#"Asked to Work?"] - [#"Able to Work?"]) else null),
    #"Sorted Rows" = Table.Sort(#"Added Day Shortfall",{{"User ID", Order.Ascending}, {"Start of Week", Order.Ascending}})
in
    #"Sorted Rows"
Show Inventory Availability by day (adding dates)
- Create a new query. This will be the actual query used to show each Employee’s availability by day.
The first few steps of the query are the same as the earlier query, up to where the data looks like this – (up to the step where the ‘Day Name’ was added.)

Show Inventory Availability by day (adding logic columns)
After this, the logic column steps for this query are also the same as the earlier query, except for the last three steps - the data is not grouped by “Start of Week” or “User ID” (the 3rd last step), and the columns “Can Work More?” and “Day Shortfall in Week?” are not added (the 2nd last, and last steps).
The 4th last step of the earlier query should look something like this (not grouped by ‘Start of Week’ or ‘User ID’):
- Next, add a buffering step, so the table sort order is not lost:
= Table.Buffer(#"Sorted Rows")
Show Inventory Availability by day (add running total column)
Now, we need to add a “Running Total” column, on the values in the column called “Days Left Available to Work?” (the last column in the data of the previous step)
- Create a Running Total function (as a separate query)
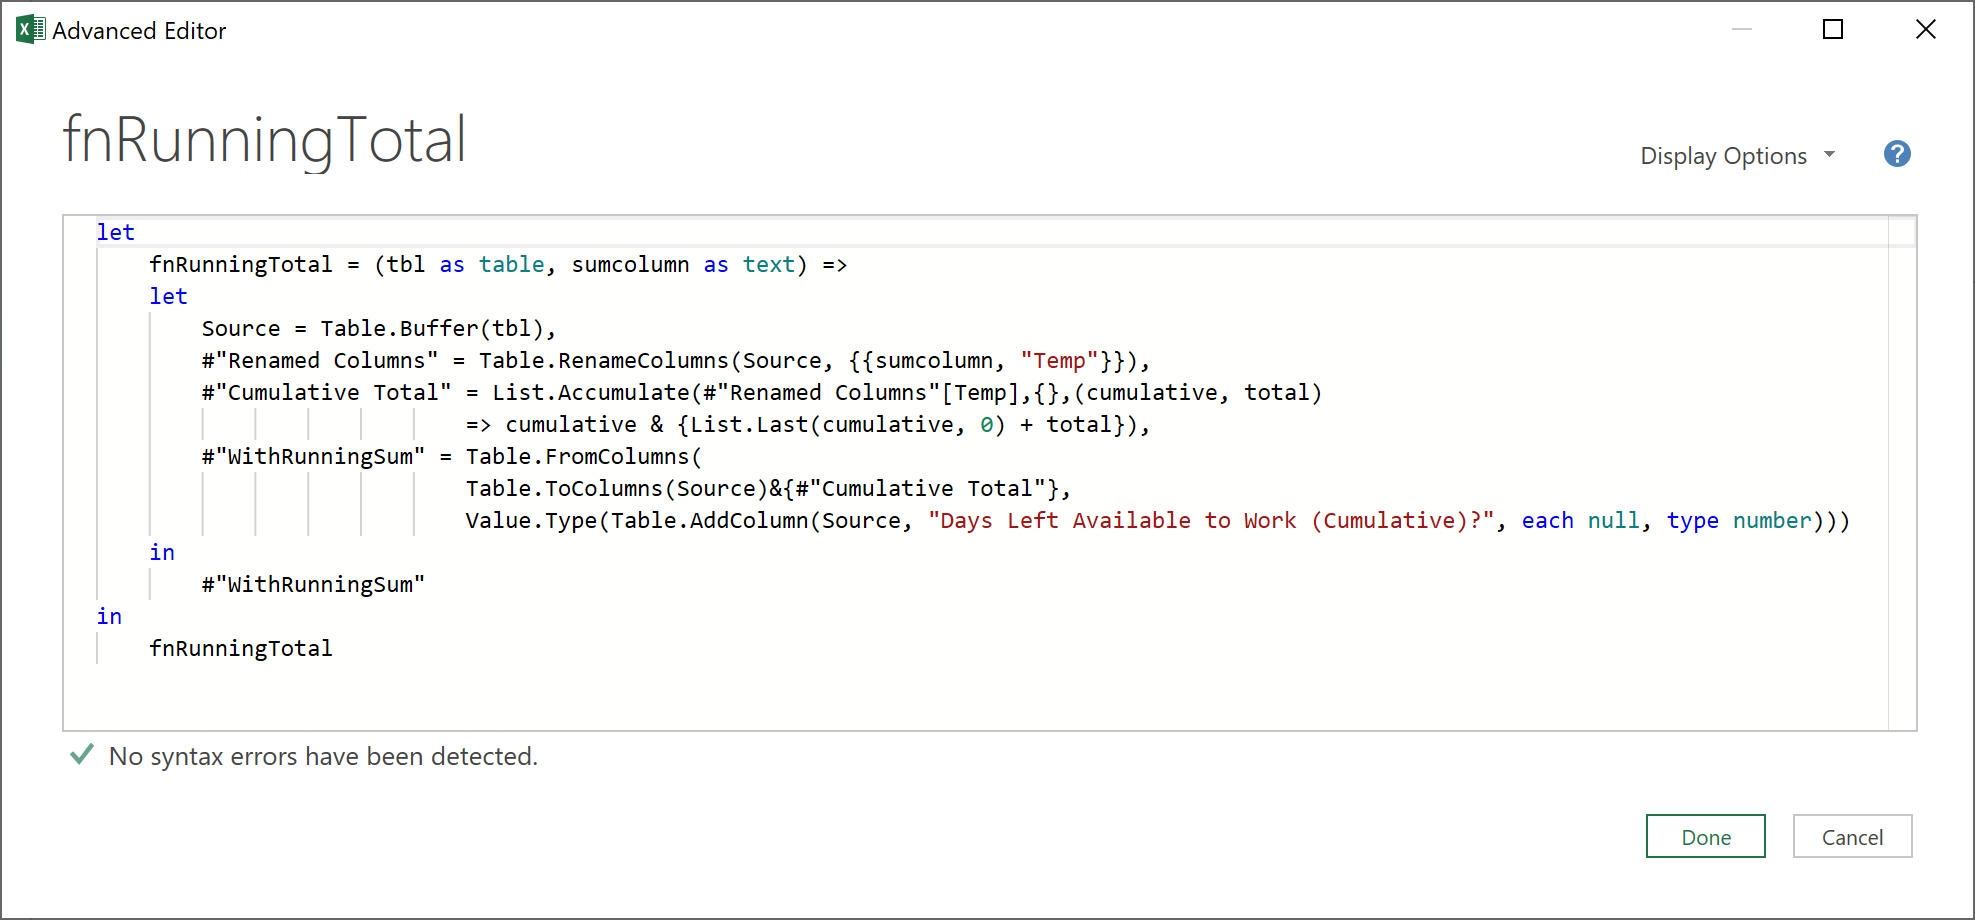
If you are interested in learning more about running total functions, the above function is very similar to the Running Total function created in this ETL article: Running Total functions, (where the workings are explained more fully), but the above function could be considered more optimised (as it has fewer lines of code)!
Focussing on the inner let / in portion of the code, after accepting two parameters: the table, and the name of column in the table to be summed (called: tbl, and sumcolumn, above respectively), the function:
- Buffers the table, and stores it to the variable, “Source”
- Renames the column to be summed (as passed through by the parameter, sumcolumn) to “Temp”
- Creates a “Running Total” list on the values in the “Temp” column, and then stores this to the variable #”Cumulative Total”
- The Table.ToColumns function then converts each column of the table “Source”, into a list of lists
- The ‘&{#”Cumulative Total”}’ appends the returned ‘running total’ list, onto the list of lists
- The Table.FromColumns then converts the list of lists back into a table, with the headings of the original table object, plus “Running Total”, as the heading of the newly appended column
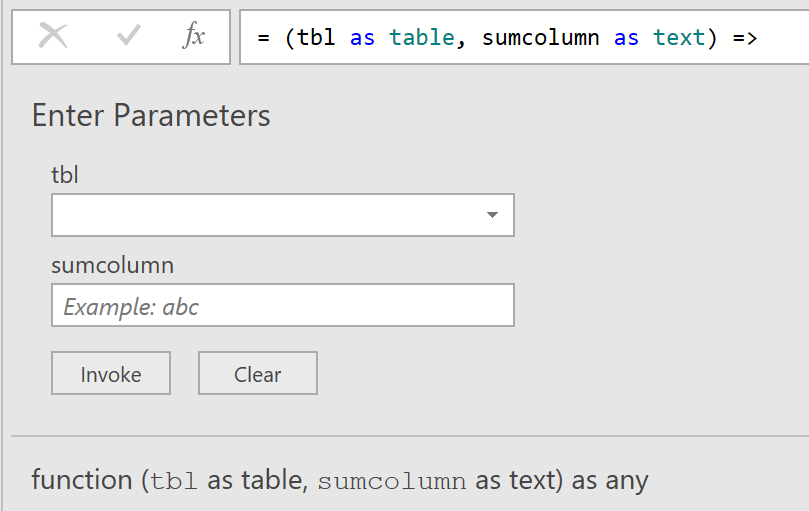
Next, call the function ‘fnRunningTotal’ – it should look something like the below, ready to accept the two parameters:
- Now, going back to the main query, group the Buffered Table step that we created, with the following ‘M’ code:
= Table.Group(#"Table Buffered", {"Start of Week", "User ID", "Country"}, {{"AllData", (_) => fnRunningTotal(_, "Days Left Available to Work?"), type table}})
To explain what is happening with this code, a bit more clearly:
- The grouping is done by “Start of Week”, “User ID”, and “Country”. A new column called “All Data” is also added that returns a table object with the relevant rows.
- Each table object, from each row, is then passed into the running total function (as a throw away variable: ‘_’), along with the name of the column (“Days Left Available to Work?”), on which we would like to create an additional running total column, in each table object.
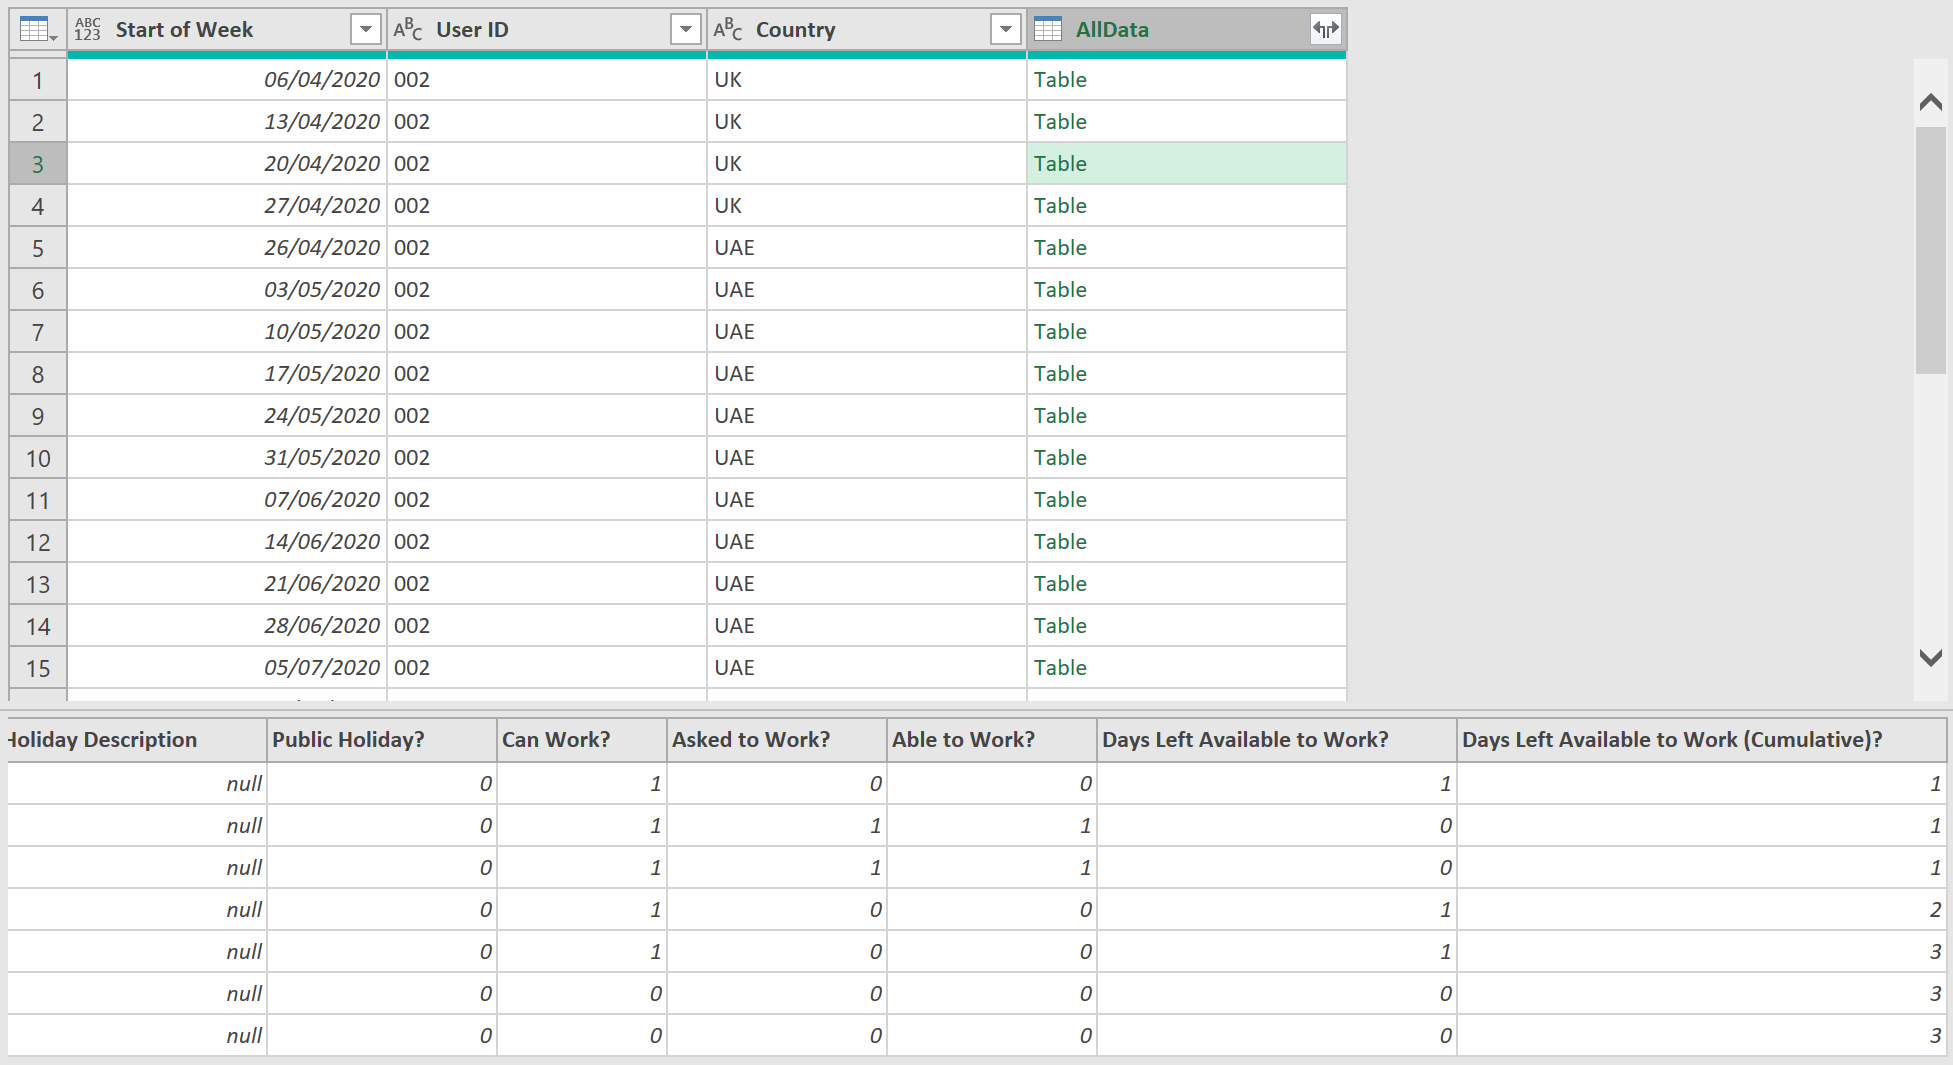
After doing this, if we then click on any table object, like the one shown below, we should see the following additional Running Total column, called “Days Left Available to Work (Cumulative)?”, as shown below:
- Now, expand all the relevant fields, from the ‘AllData’ column, using the following ‘M’ code:
= Table.ExpandTableColumn(#"Grouped Rows with Running Total", "AllData", List.RemoveItems(Table.ColumnNames(#"Table Buffered")&{"Days Left Available to Work (Cumulative)?"}, {"Start of Week", "User ID", "Country"}))
This code extracts all table fields as they existed in the Buffered Table step, together with the name of the new running total column, except for the ‘Start of Week’, ‘User ID’, and ‘Country’ fields, as these already exist as columns, in the Grouping Step.
Show Inventory Availability by day (add columns from Shortfall check query)
Now, we will use the results from the shortfall check query created earlier, specifically the data in the “Can Work More?” and “Day Shortfall in Week?” columns
- Merge this query with the shortfall query created earlier on the following columns (only up to the Country field - don’t choose department)
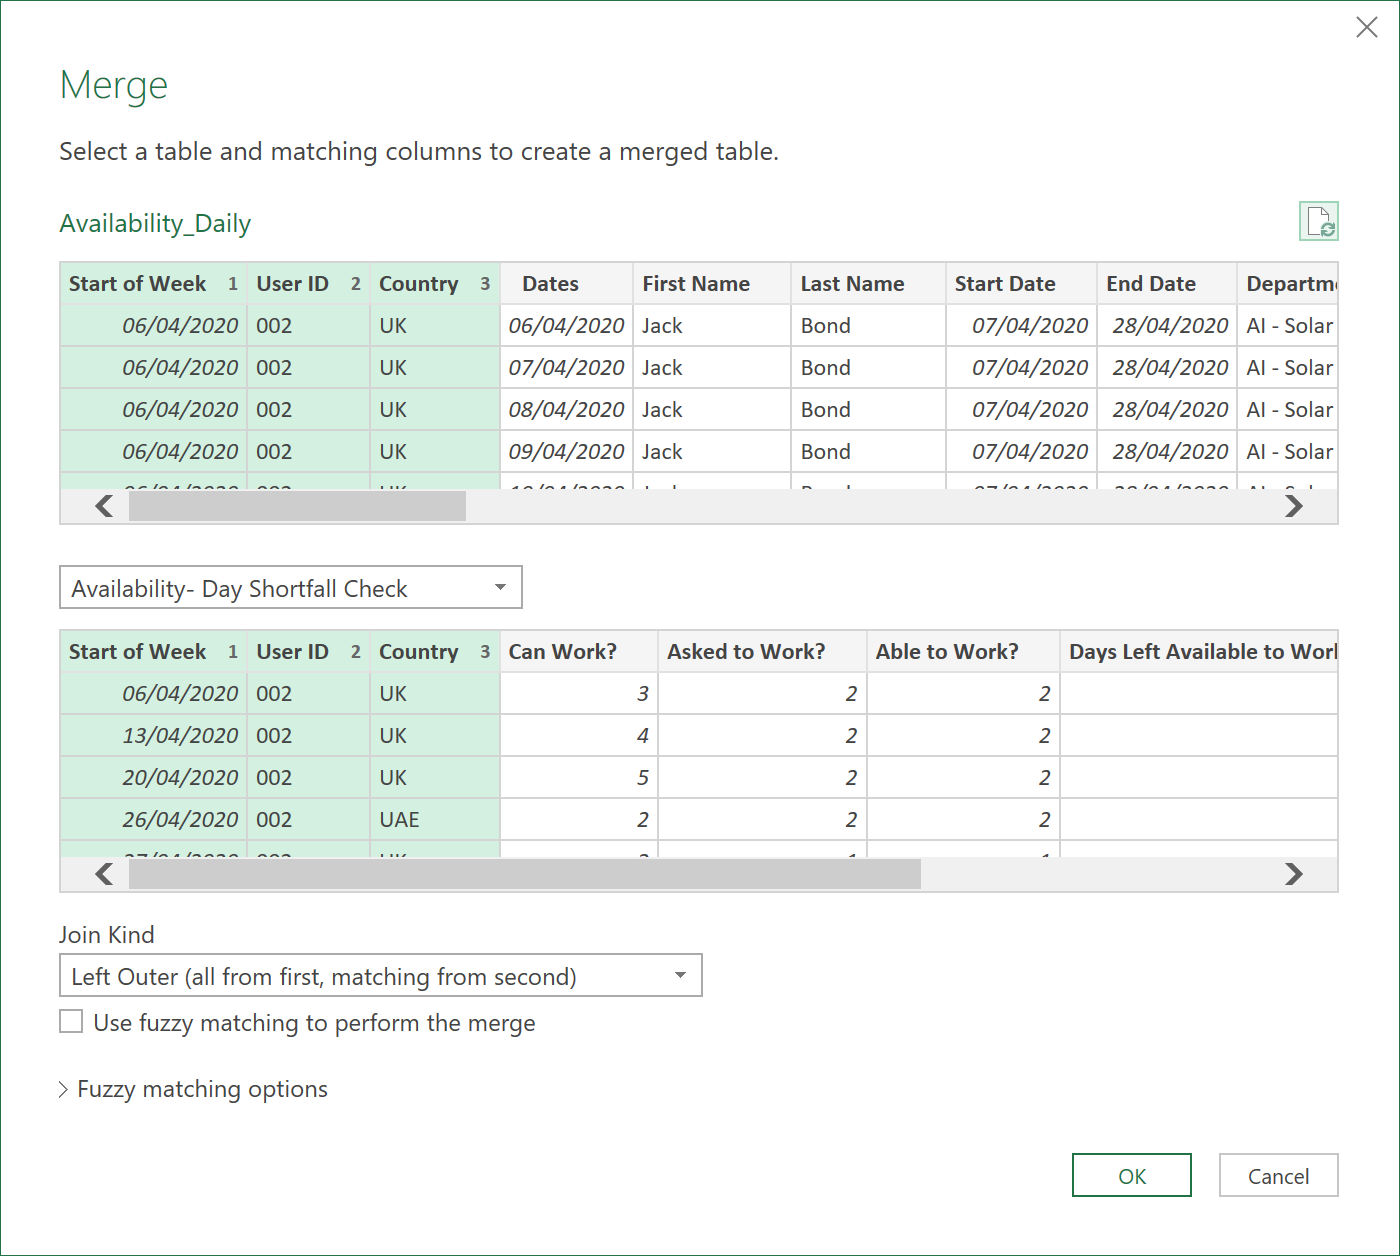
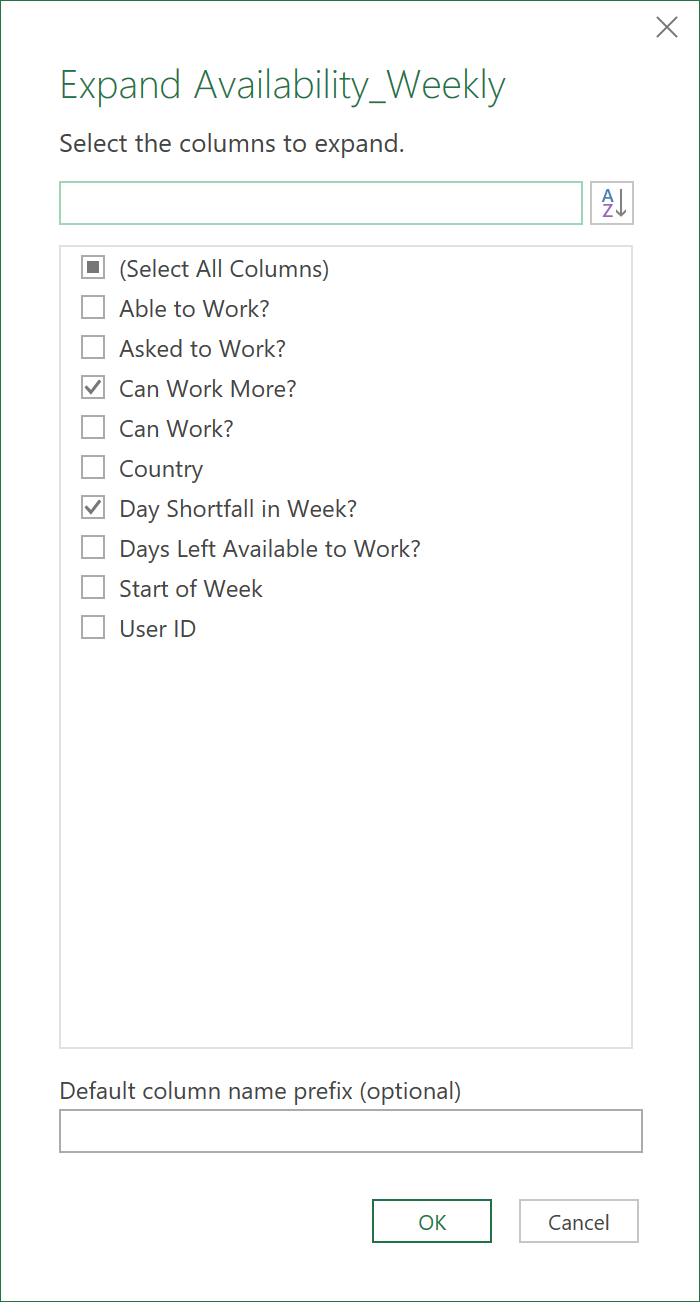
- Extract the following fields:
- Next, replace any nulls in the “Day Shortfall in Week?” column with 0s, using the following code:
= Table.ReplaceValue(#"Expanded Inventory_Table_Weekly",null,0,Replacer.ReplaceValue,{"Day Shortfall in Week?"})
- Add the following two custom columns:
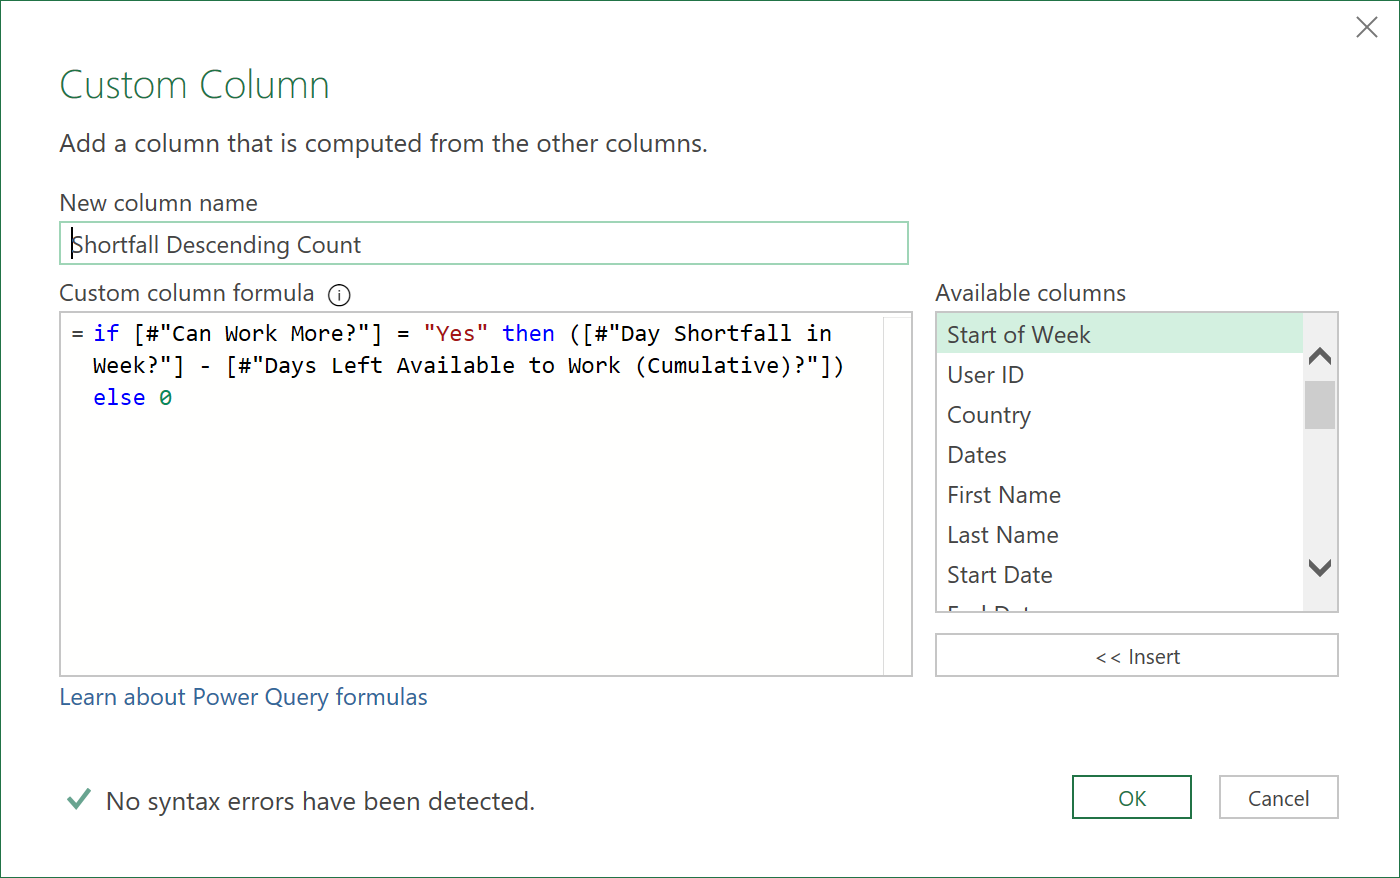
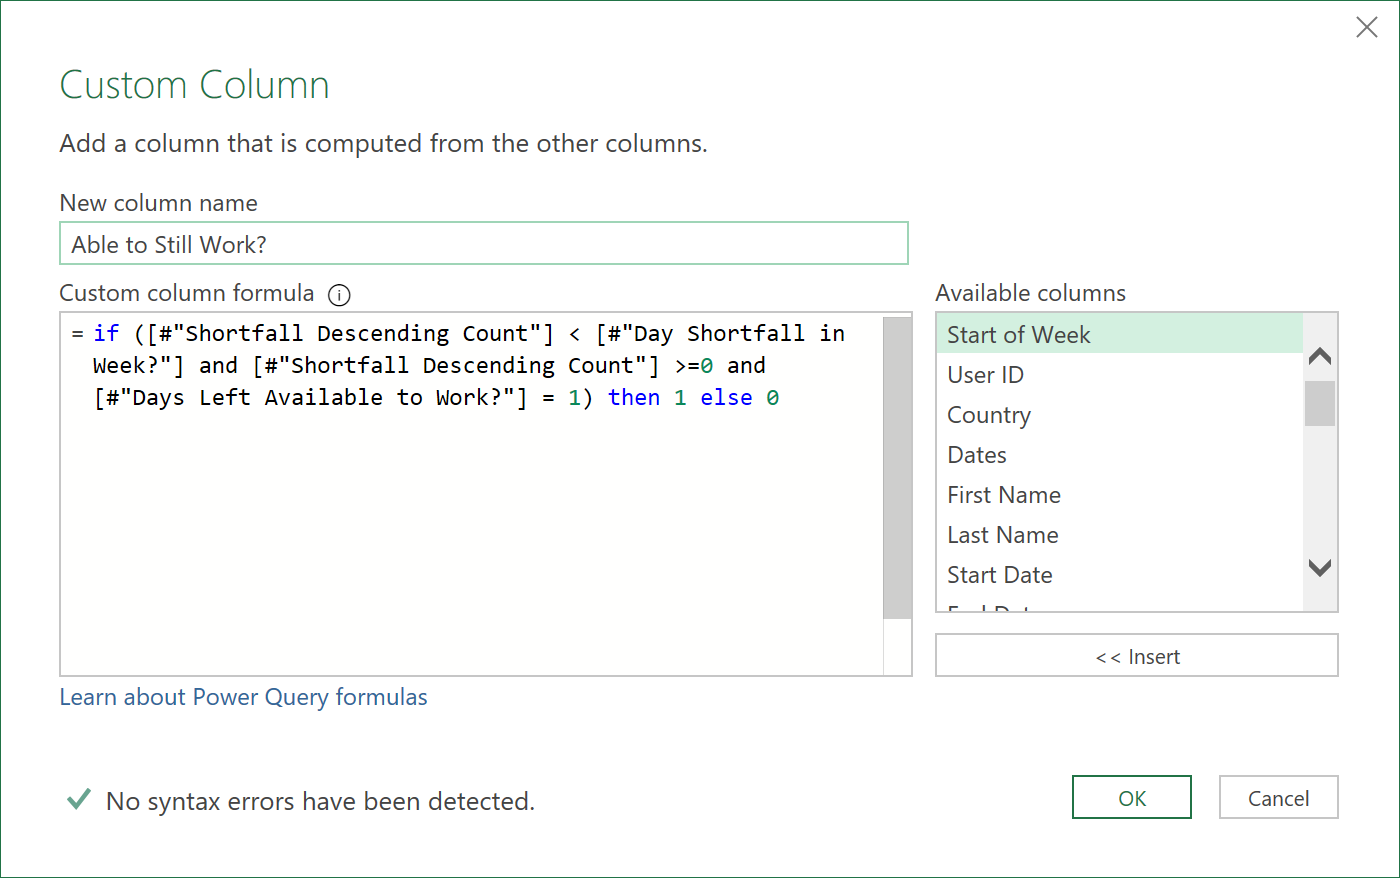
These two columns will automatically re-allocate working days for Part time Employees, in case they could not work on their preferred day (e.g. due to Company or Public Holidays).
- Next, add the following custom column:
This column shows the days worked, plus any days not worked that were re-allocated to other days
- Now, add the following custom column:
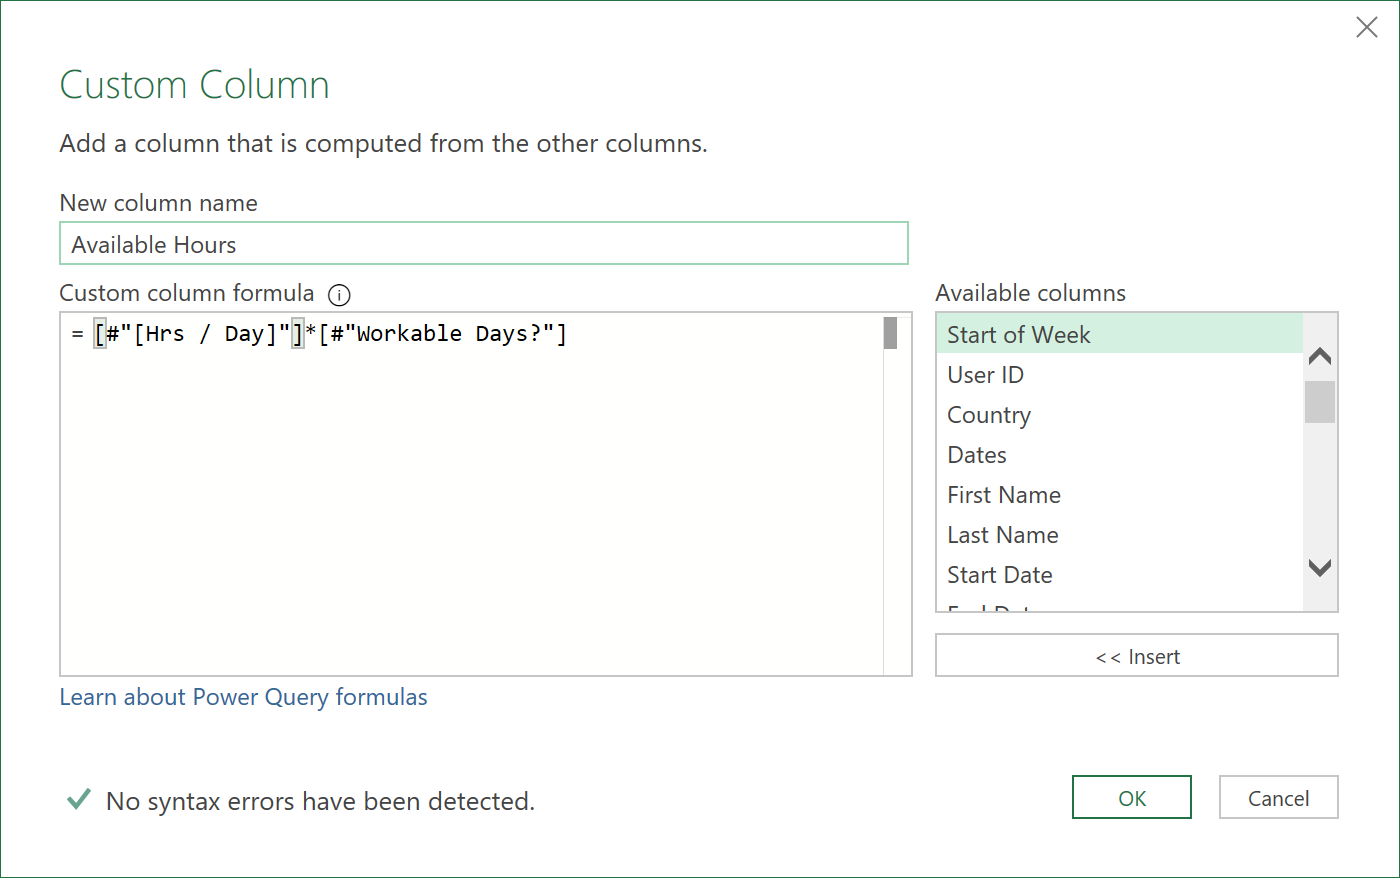
This column converts the days worked from the workable days column, into hours (that were specified in the original source table).
- With the above step complete, we can now remove the following columns, as they are no longer needed
= Table.RemoveColumns(#"Added Available Hours",{"Full or Part", "Working Days", "Days Left Available to Work (Cumulative)?", "Shortfall Descending Count", "[Hrs / Day]"})
- Next, add another ‘Start of Week’ column, but this time, one that always starts on Monday. This column can be used for reporting purposes (as the reporting is multi-jurisdictional, a consistent ‘Start of Week’ column is also needed).
- Finally, place this column to the front of the dataset, by re-ordering the columns
- Sort the data again by the ‘User ID’ and then “Dates’ columns, as the order will have been lost from the Merge query operations above
-
Call the query: ‘Availability – Daily’
-
The final ‘ETL’ code should look something like this:
let
Source = Inventory_Availability_SCD,
#"Fill in End Dates" = Table.ReplaceValue(Source,null,Max_Date,Replacer.ReplaceValue,{"End Date"}),
Monday = Table.ReplaceValue(#"Fill in End Dates","Yes","Monday",Replacer.ReplaceText,{"Mon"}),
Tuesday = Table.ReplaceValue(Monday,"Yes","Tuesday",Replacer.ReplaceText,{"Tue"}),
Wednesday = Table.ReplaceValue(Tuesday,"Yes","Wednesday",Replacer.ReplaceText,{"Wed"}),
Thursday = Table.ReplaceValue(Wednesday,"Yes","Thursday",Replacer.ReplaceText,{"Thu"}),
Friday = Table.ReplaceValue(Thursday,"Yes","Friday",Replacer.ReplaceText,{"Fri"}),
Saturday = Table.ReplaceValue(Friday,"Yes","Saturday",Replacer.ReplaceText,{"Sat"}),
Sunday = Table.ReplaceValue(Saturday,"Yes","Sunday",Replacer.ReplaceText,{"Sun"}),
#"Merged Columns" = Table.CombineColumns(Sunday,{"Mon", "Tue", "Wed", "Thu", "Fri", "Sat", "Sun"},Combiner.CombineTextByDelimiter(", ", QuoteStyle.None),"Merged Days"),
#"Added Working Days" = Table.AddColumn(#"Merged Columns", "Working Days", each if ([Full or Part] = "Full" and [Country] <> "UAE") then "Monday, Tuesday, Wednesday, Thursday, Friday" else if ([Full or Part] = "Full" and [Country] = "UAE") then "Monday, Tuesday, Wednesday, Thursday, Sunday" else [Merged Days]),
#"Removed Columns" = Table.RemoveColumns(#"Added Working Days",{"Merged Days"}),
#"Inserted Start of Week" = Table.AddColumn(#"Removed Columns", "Start of Week", each if ([Country] = "UAE") then Date.StartOfWeek([Start Date], Day.Sunday) else Date.StartOfWeek([Start Date], Day.Monday)),
#"Inserted End of Week" = Table.AddColumn(#"Inserted Start of Week", "End of Week", each if ([Country] = "UAE") then Date.EndOfWeek([End Date], Day.Sunday) else Date.EndOfWeek([End Date], Day.Monday)),
#"Added Custom" = Table.AddColumn(#"Inserted End of Week", "Dates", each { Number.From([Start of Week])..Number.From([End of Week]) }),
#"Expanded Dates" = Table.ExpandListColumn(#"Added Custom", "Dates"),
#"Changed Type" = Table.TransformColumnTypes(#"Expanded Dates",{{"Dates", type date}}),
#"Filtered Dates" = Table.SelectRows(#"Changed Type", each [Dates] >= Min_Date and [Dates] <= Max_Date),
#"Added Date Boundary 1" = Table.AddColumn(#"Filtered Dates", "Boundary 1", each if [Start Date] > [Dates] then 1 else 0),
#"Added Date Boundary 2" = Table.AddColumn(#"Added Date Boundary 1", "Boundary 2", each if [End Date] < [Dates] then 1 else 0),
#"Grouped Rows1" = Table.Group(#"Added Date Boundary 2", {"User ID", "Dates"}, {{"Details", each _, type table [User ID=text, First Name=text, Last Name=text, Start Date=date, End Date=date, Country=text, Department=text, Full or Part=text, #"[Hrs / Day]"=number, Working Days=text, Start of Week=date, End of Week=date, Dates=date, Boundary 1=number, Boundary 2=number]}, {"Duplicates", each Table.RowCount(_), type number}}),
#"Expanded Details" = Table.ExpandTableColumn(#"Grouped Rows1", "Details", {"First Name", "Last Name", "Start Date", "End Date", "Country", "Department", "Full or Part", "[Hrs / Day]", "Working Days", "Start of Week", "End of Week", "Boundary 1", "Boundary 2"}, {"First Name", "Last Name", "Start Date", "End Date", "Country", "Department", "Full or Part", "[Hrs / Day]", "Working Days", "Start of Week", "End of Week", "Boundary 1", "Boundary 2"}),
#"Added Remove Duplicates" = Table.AddColumn(#"Expanded Details", "Remove", each if ([Boundary 1] = 1 or [Boundary 2] = 1) and ([Duplicates] > 1) then 1 else 0),
#"Filtered Duplicated Out" = Table.SelectRows(#"Added Remove Duplicates", each ([Remove] = 0)),
#"Removed Columns1" = Table.RemoveColumns(#"Filtered Duplicated Out",{"Start of Week", "End of Week", "Boundary 1", "Boundary 2", "Duplicates", "Remove"}),
#"Inserted Start of Week 2" = Table.AddColumn(#"Removed Columns1", "Start of Week", each if ([Country] = "UAE") then Date.StartOfWeek([Dates], Day.Sunday) else Date.StartOfWeek([Dates], Day.Monday)),
#"Inserted Day Name" = Table.AddColumn(#"Inserted Start of Week 2", "Day Name", each Date.DayOfWeekName([Dates]), type text),
#"Added With Company" = Table.AddColumn(#"Inserted Day Name", "With Company?", each if ([Dates] >= [Start Date] and [Dates] <= [End Date]) then 1 else 0),
#"Added Weekday" = Table.AddColumn(#"Added With Company", "Weekday?", each if ([Day Name] = "Friday" or [Day Name] = "Saturday") and ([Country] = "UAE") then 0 else if ([Day Name] = "Saturday" or [Day Name] = "Sunday") and ([Country] <> "UAE") then 0 else 1),
#"Merged Queries" = Table.NestedJoin(#"Added Weekday", {"Country", "Dates"}, Public_Holidays, {"Country", "Date"}, "Holiday_Table", JoinKind.LeftOuter),
#"Expanded Holiday Description" = Table.ExpandTableColumn(#"Merged Queries", "Holiday_Table", {"Description"}, {"Holiday Description"}),
#"Added Public Holiday" = Table.AddColumn(#"Expanded Holiday Description", "Public Holiday?", each if [Holiday Description] = null then 0 else 1),
#"Added Can Work" = Table.AddColumn(#"Added Public Holiday", "Can Work?", each if ([#"With Company?"] = 1 and [#"Weekday?"] = 1 and [#"Public Holiday?"] = 0) then 1 else 0),
#"Added Asked to Work" = Table.AddColumn(#"Added Can Work", "Asked to Work?", each if Text.Contains([Working Days], [Day Name]) then 1 else 0),
#"Added Able to Work" = Table.AddColumn(#"Added Asked to Work", "Able to Work?", each if ([#"Can Work?"] = 1 and [#"Asked to Work?"] = 1) then 1 else 0),
#"Added Days Left Available to Work" = Table.AddColumn(#"Added Able to Work", "Days Left Available to Work?", each if [#"Can Work?"] > [#"Able to Work?"] then 1 else 0),
#"Sorted Rows" = Table.Sort(#"Added Days Left Available to Work",{{"User ID", Order.Ascending}, {"Dates", Order.Ascending}}),
#"Table Buffered" = Table.Buffer(#"Sorted Rows"),
#"Grouped Rows with Running Total" = Table.Group(#"Table Buffered", {"Start of Week", "User ID", "Country"}, {{"AllData", (_) => fnRunningTotal(_, "Days Left Available to Work?"), type table}}),
#"Expand Relevant Fields" = Table.ExpandTableColumn(#"Grouped Rows with Running Total", "AllData", List.RemoveItems(Table.ColumnNames(#"Table Buffered")&{"Days Left Available to Work (Cumulative)?"}, {"Start of Week", "User ID", "Country"})),
#"Merged Queries1" = Table.NestedJoin(#"Expand Relevant Fields", {"Start of Week", "User ID", "Country"}, #"Availability - Day Shortfall Check", {"Start of Week", "User ID", "Country"}, "Availability_Weekly", JoinKind.LeftOuter),
#"Expanded Inventory_Table_Weekly" = Table.ExpandTableColumn(#"Merged Queries1", "Availability_Weekly", {"Can Work More?", "Day Shortfall in Week?"}, {"Can Work More?", "Day Shortfall in Week?"}),
#"Replaced Value" = Table.ReplaceValue(#"Expanded Inventory_Table_Weekly",null,0,Replacer.ReplaceValue,{"Day Shortfall in Week?"}),
#"Added Shortfall Descending Count" = Table.AddColumn(#"Replaced Value", "Shortfall Descending Count", each if [#"Can Work More?"] = "Yes" then ([#"Day Shortfall in Week?"] - [#"Days Left Available to Work (Cumulative)?"]) else 0),
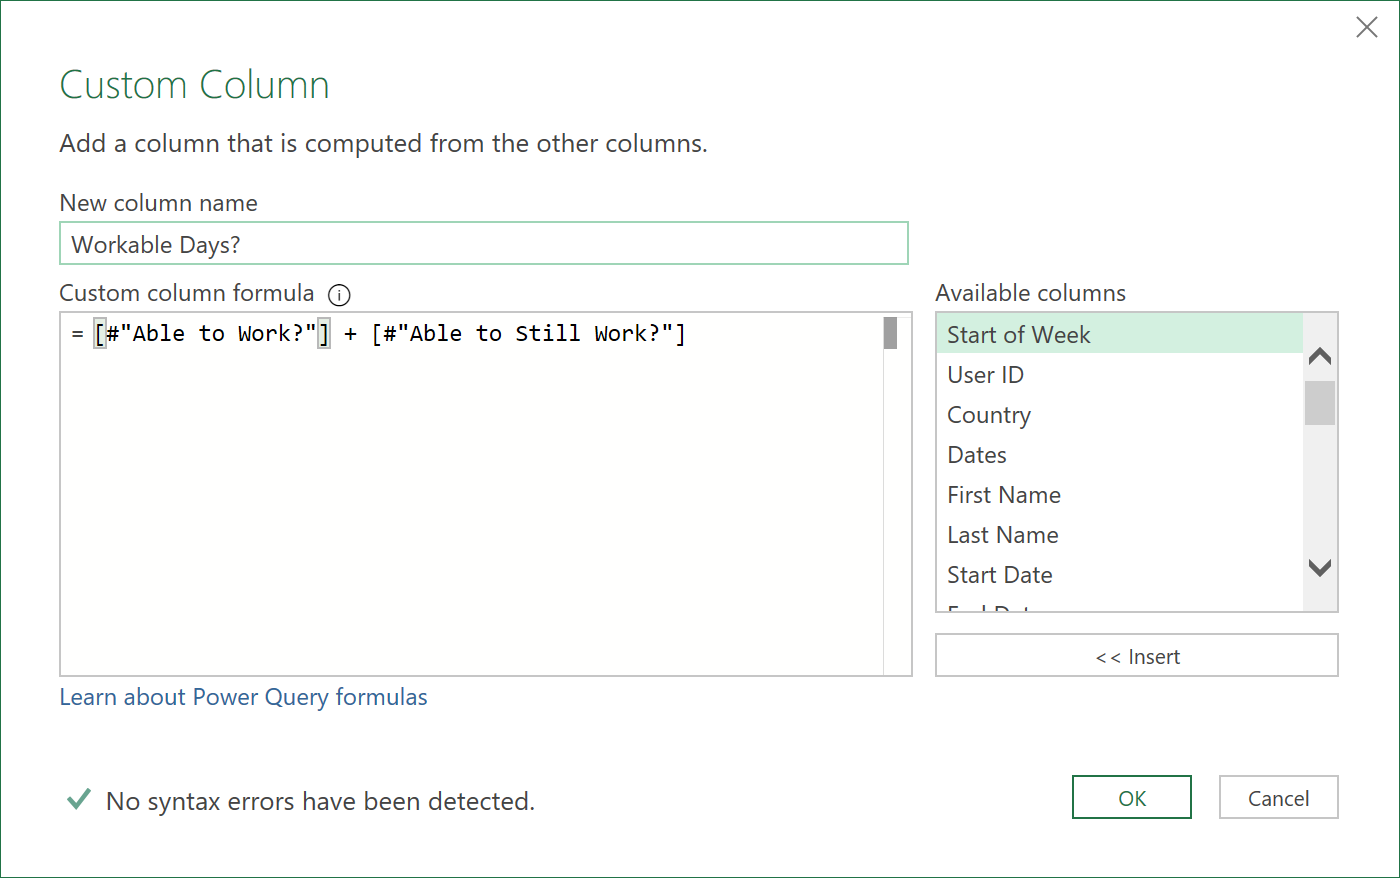
#"Added Able to Still Work" = Table.AddColumn(#"Added Shortfall Descending Count", "Able to Still Work?", each if ([#"Shortfall Descending Count"] < [#"Day Shortfall in Week?"] and [#"Shortfall Descending Count"] >=0 and [#"Days Left Available to Work?"] = 1) then 1 else 0),
#"Added Workable Days" = Table.AddColumn(#"Added Able to Still Work", "Workable Days?", each [#"Able to Work?"] + [#"Able to Still Work?"]),
#"Added Available Hours" = Table.AddColumn(#"Added Workable Days", "Available Hours", each [#"[Hrs / Day]"]*[#"Workable Days?"]),
#"Removed Columns 2" = Table.RemoveColumns(#"Added Available Hours",{"Full or Part", "Working Days", "Days Left Available to Work (Cumulative)?", "Shortfall Descending Count", "[Hrs / Day]"}),
#"Inserted Start of Week Mon" = Table.AddColumn(#"Removed Columns 2", "Start of Week (Mon)", each Date.StartOfWeek([Dates], Day.Monday), type date),
#"Reordered Columns" = Table.ReorderColumns(#"Inserted Start of Week Mon",{"Start of Week (Mon)", "Start of Week", "User ID", "Country", "First Name", "Last Name", "Start Date", "End Date", "Department", "Dates", "Day Name", "With Company?", "Weekday?", "Holiday Description", "Public Holiday?", "Can Work?", "Asked to Work?", "Able to Work?", "Days Left Available to Work?", "Can Work More?", "Day Shortfall in Week?", "Able to Still Work?", "Workable Days?", "Available Hours"}),
#"Sorted Rows1" = Table.Sort(#"Reordered Columns",{{"User ID", Order.Ascending}, {"Dates", Order.Ascending}})
in
#"Sorted Rows1"
Show Inventory Availability by week
To show available hours by week:
- Create a reference to the earlier ‘Availability’ query
- Buffer the Table, so the sort order won’t be lost in later steps:
= Table.Buffer(Source)
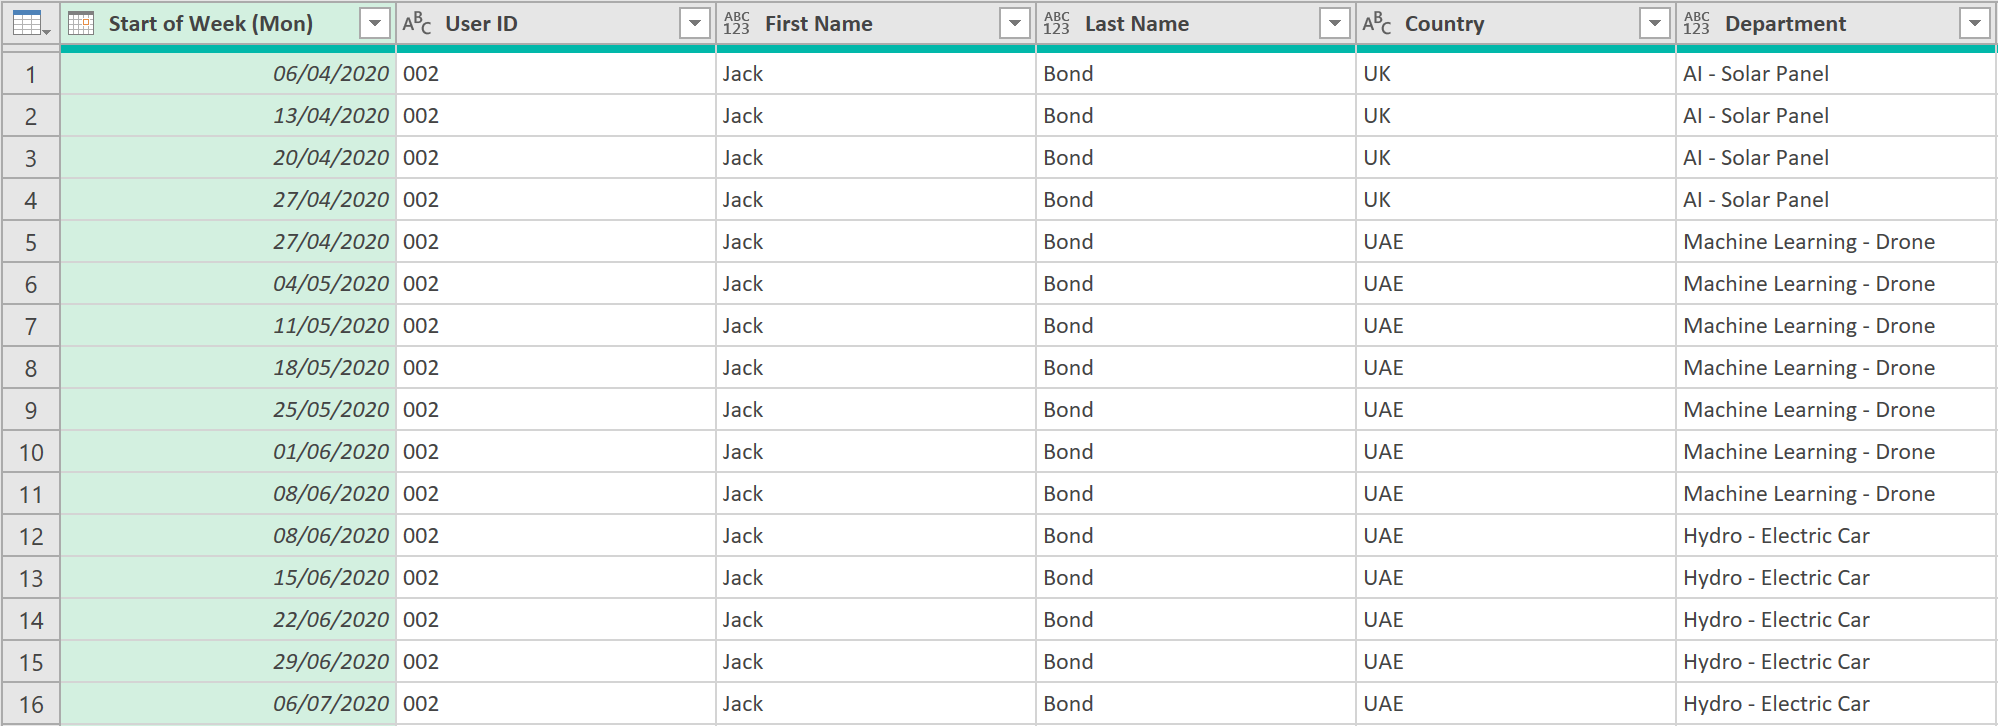
- Group the data on the following fields, and add other relevant columns (as summations for each week):
The data should finally look like this, showing each Employee’s availability in hours, by week:
-
Call the query: ‘Availability – Weekly’
-
The final ‘ETL’ code should look something like this:
let
    Source = #"Availability - Daily",
    #"Table Buffered" = Table.Buffer(Source),
    #"Grouped Rows" = Table.Group(Table.Buffer(#"Table Buffered"), {"Start of Week (Mon)", "User ID", "First Name", "Last Name", "Country", "Department"}, {{"Can Work?", each List.Sum([#"Can Work?"]), type number}, {"Asked to Work?", each List.Sum([#"Asked to Work?"]), type number}, {"Able to Work?", each List.Sum([#"Able to Work?"]), type number}, {"Days Left Available to Work?", each List.Sum([#"Days Left Available to Work?"]), type number}, {"Able to Still Work?", each List.Sum([#"Able to Still Work?"]), type number}, {"Workable Days?", each List.Sum([#"Workable Days?"]), type number}, {"Available Hours", each List.Sum([Available Hours]), type number}})
in
    #"Grouped Rows"
Show Inventory Use by week
Now, to show actual inventory use (i.e. actual hours), by week, take the following steps:
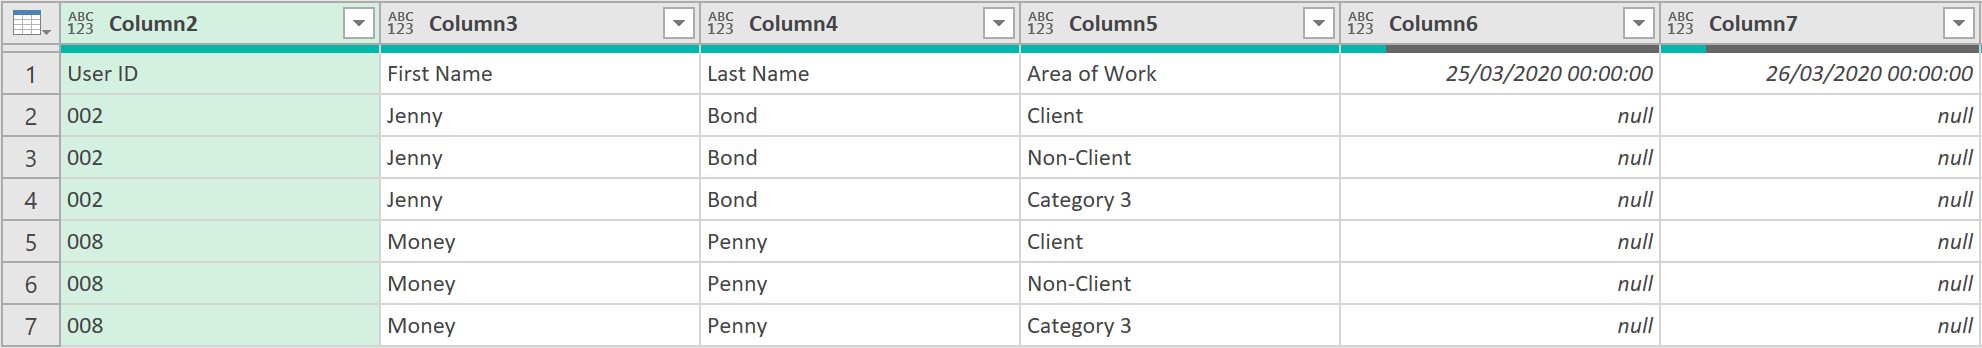
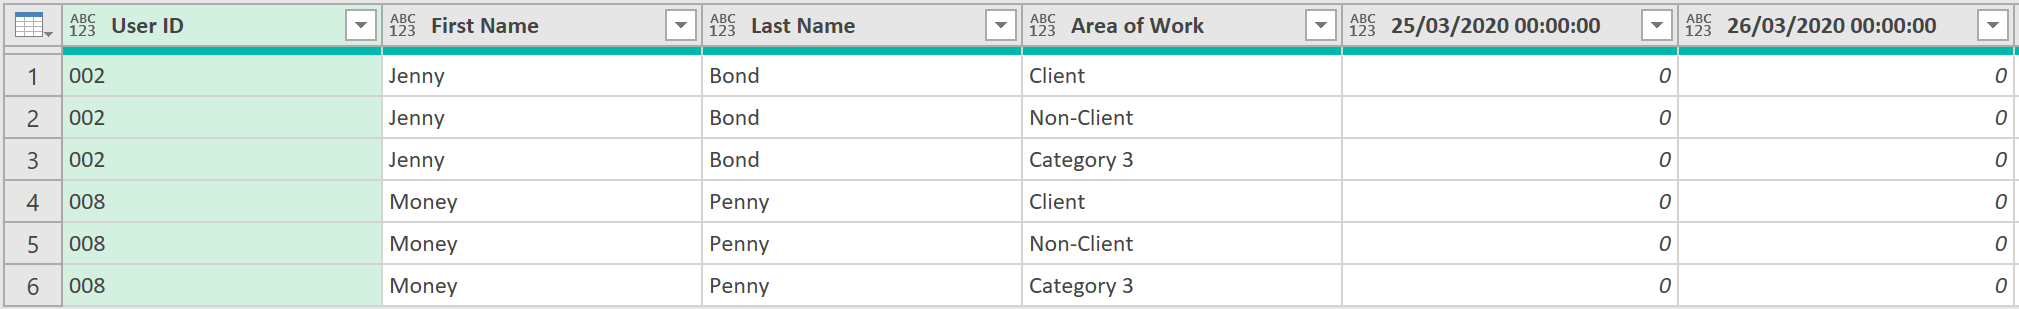
- Load the Inventory Use data at the very top of this article into Power Query so it looks something like this:
- Use the following formula to turn all columns into a list of lists, and then, in each list, to replace any nulls or blanks with a 0
= List.Transform(Table.ColumnNames(#"Removed Columns"), each {_, (_) => if _ = null or _ = "" then 0 else _})
- Next, turn the list of lists back into a table with columns, like so:
= Table.TransformColumns(#"Removed Columns", #"ReplacedNullandBlanks")
- Promote the top row, as column headers, so the data looks like this:
- Unpivot all columns apart from the “User ID”, “First Name”, “Last Name”, and “Area of Work” columns, like so:
= Table.UnpivotOtherColumns(#"Promoted Headers", {"User ID", "First Name", "Last Name", "Area of Work"}, "Attribute", "Value")
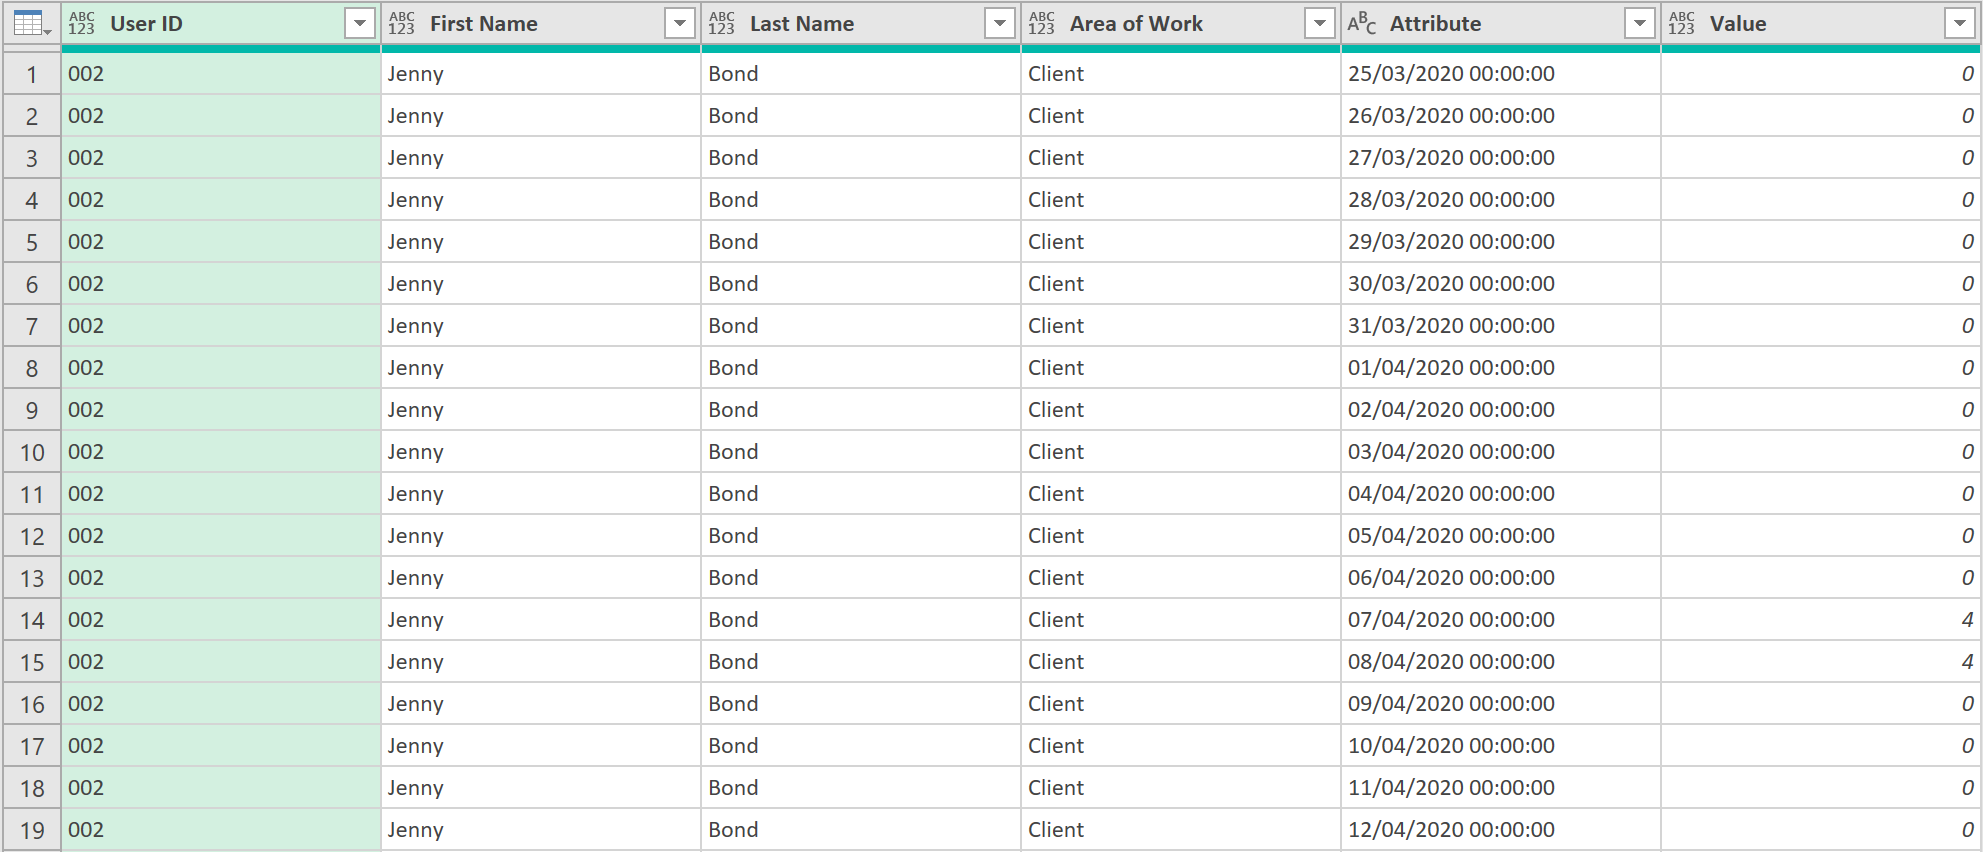
- Filter the ‘Attribute’ column to include only those rows with Dates, using the following code
= Table.SelectRows(#"Unpivoted Other Columns", each Text.Contains([Attribute], "/"))
- Change the data type of the ‘Attribute’ field to Date/Time
- Then rename the field to ‘Date’
- Then, change the data type to just Date
- Next, rename the ‘Value’ column to ‘Worked Hours’
- Then, insert the following custom column
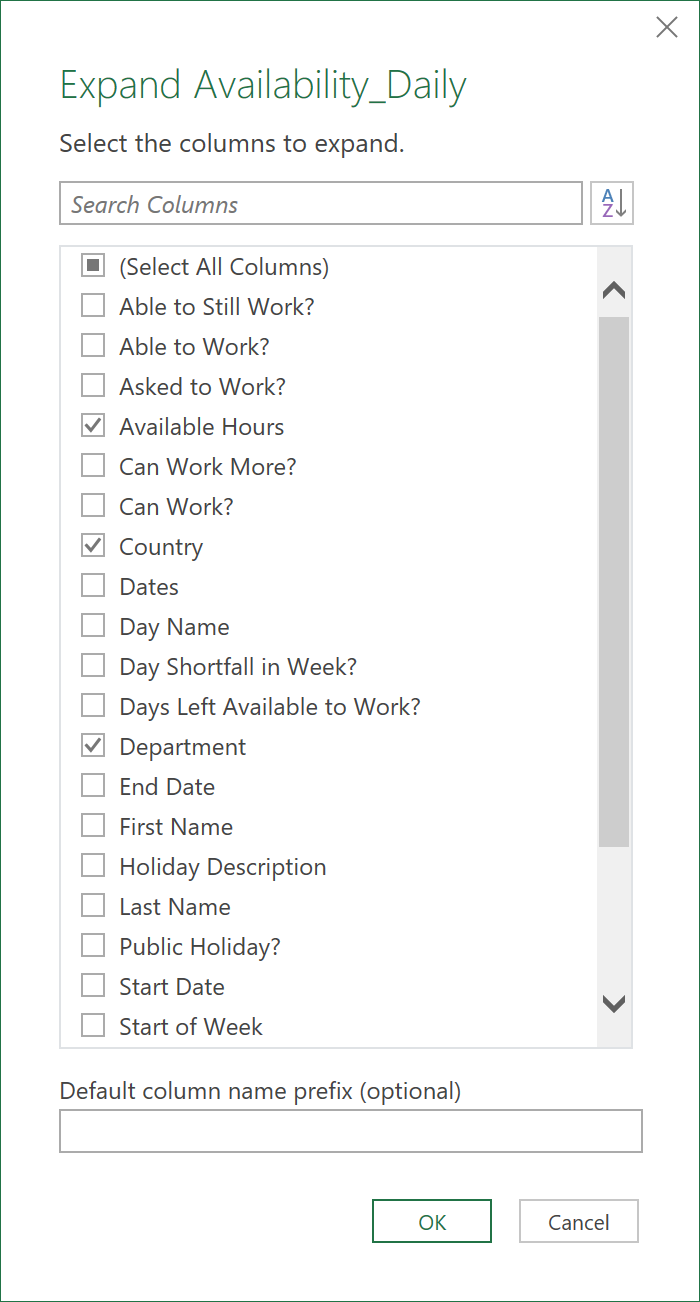
- Apply the following ‘Merge’ operation to get the hourly data from the Daily Availability query
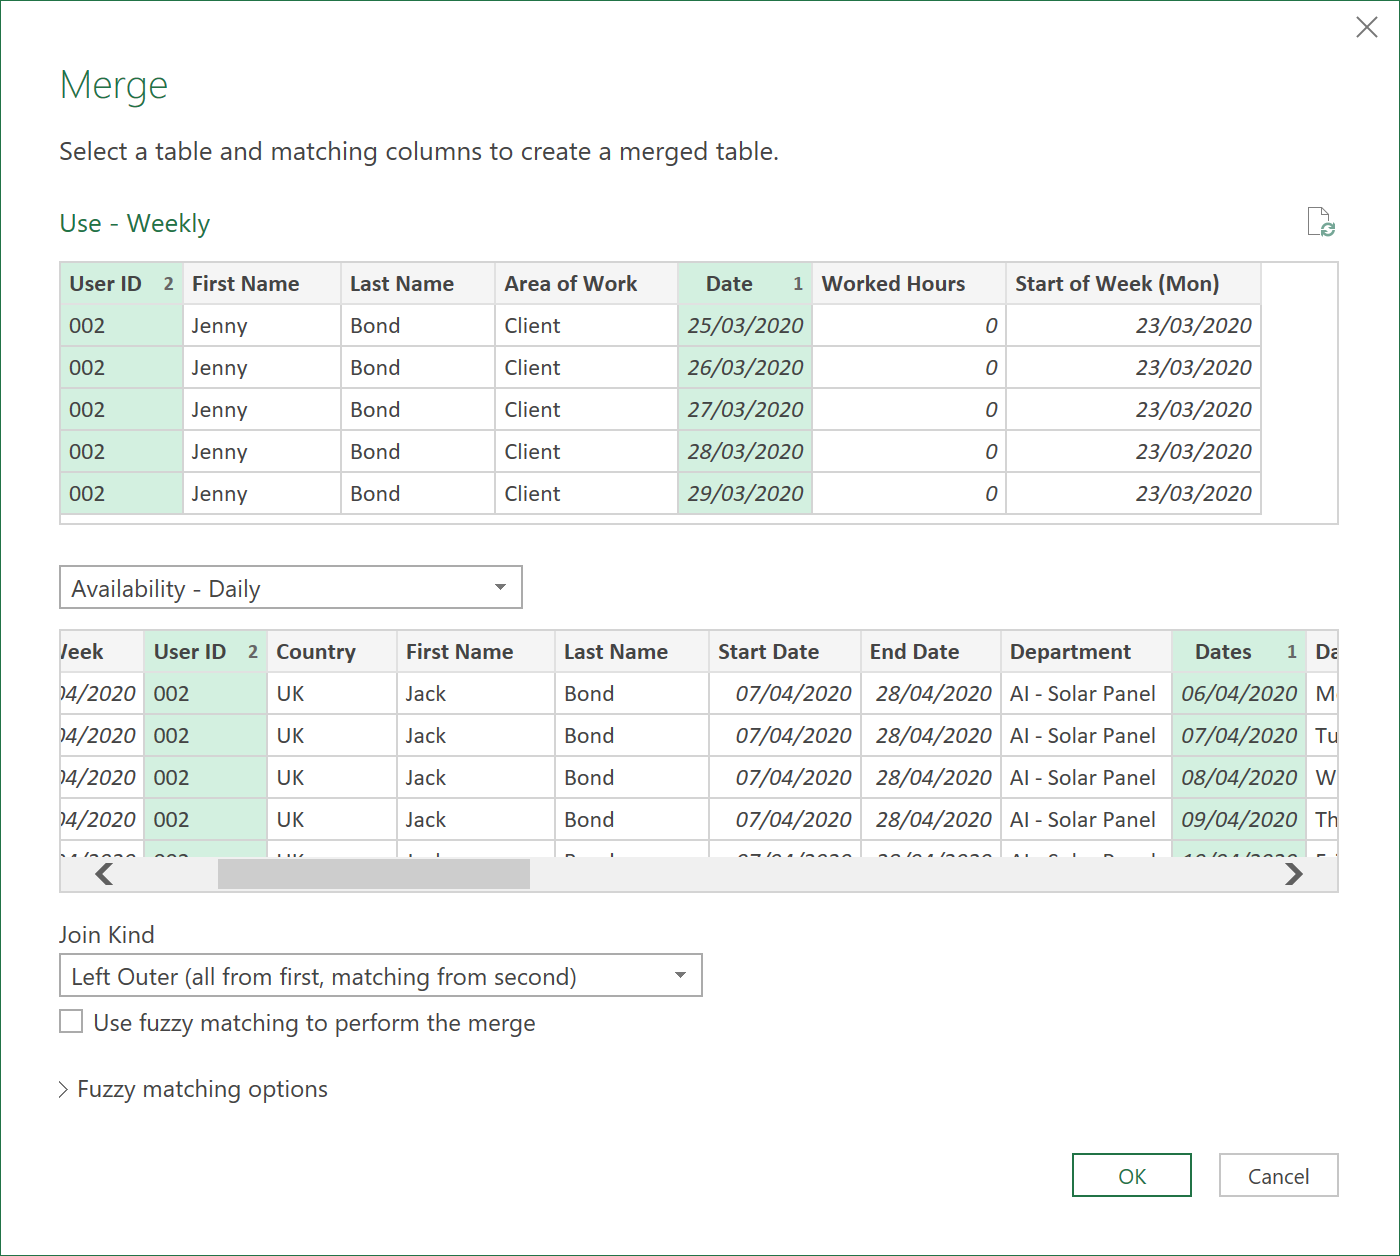
- Extract the following fields
Note:
As the Employee’s Department and Country can change, it is better to take these fields from the Availability data, rather than to record this in the Timesheet data, and take these from there. Just a ‘User ID’ field in the Timesheet data is sufficient, as this should seldom ever change for the same person.
- Sort the data using the following ‘M’ code, as the order will have been lost from the Merge Query operation above
= Table.Sort(#"Expanded Availability_Daily",{{"User ID", Order.Ascending}, {"Date", Order.Ascending}, {"Country", Order.Ascending}, {"Department", Order.Ascending}})
- Buffer the results so the sort order is not lost in the next group by step
= Table.Buffer(#"Sorted Rows1")
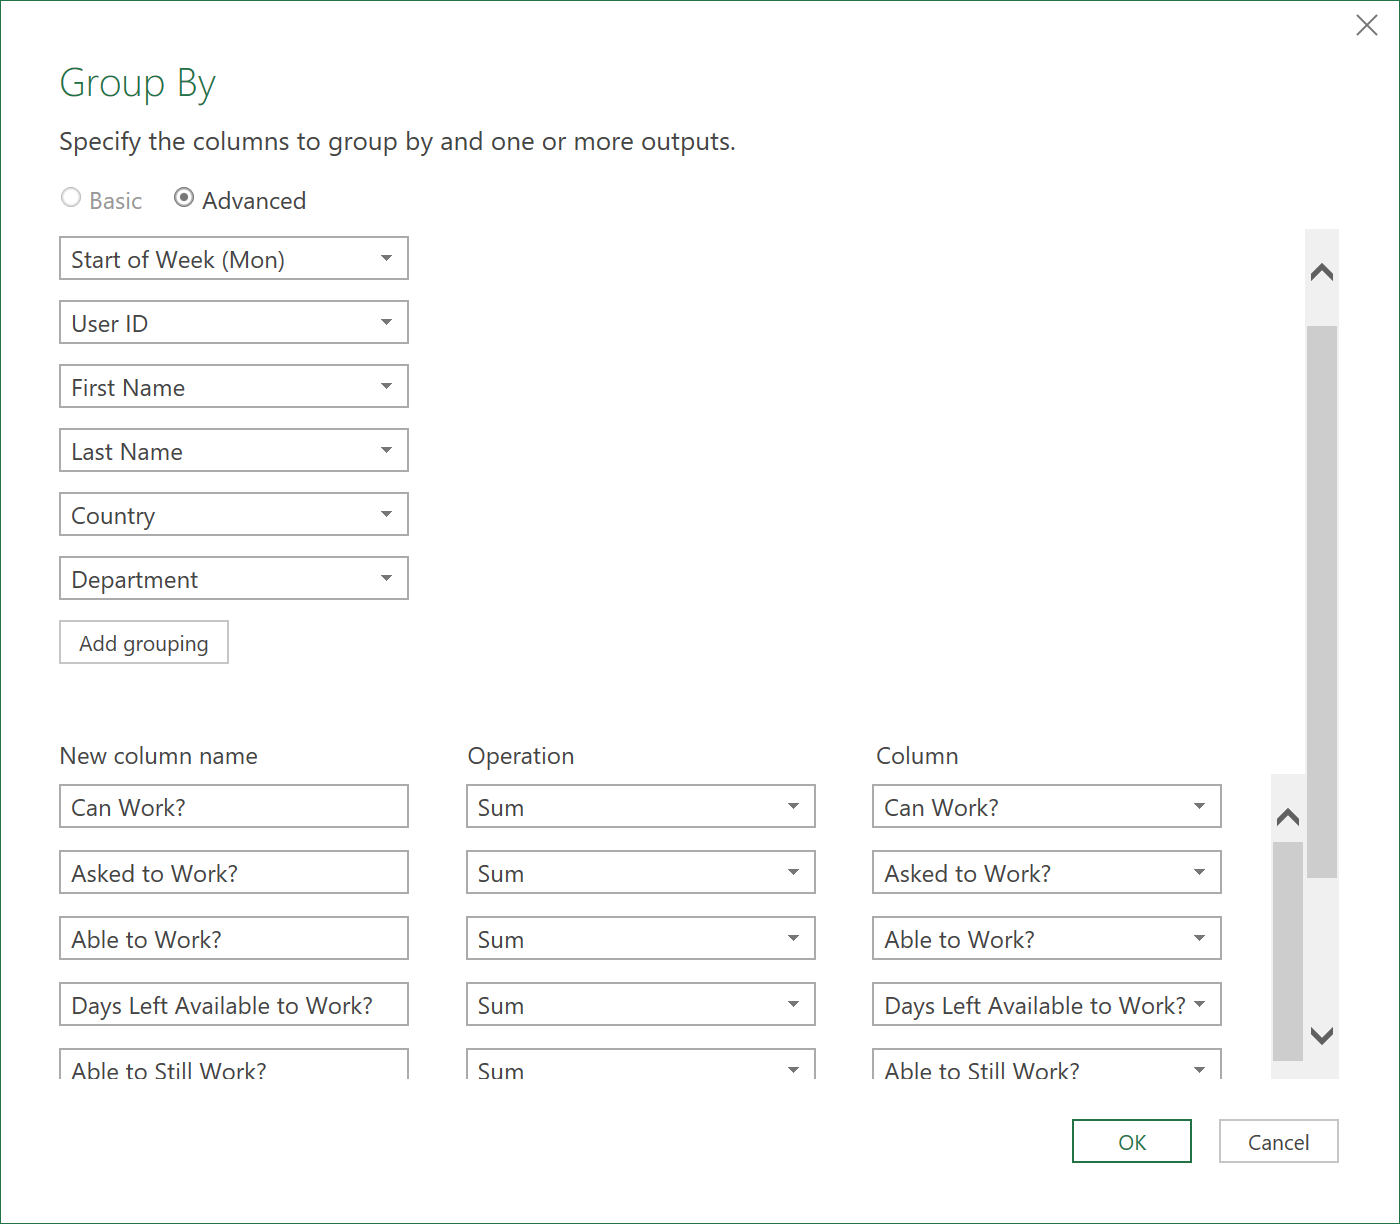
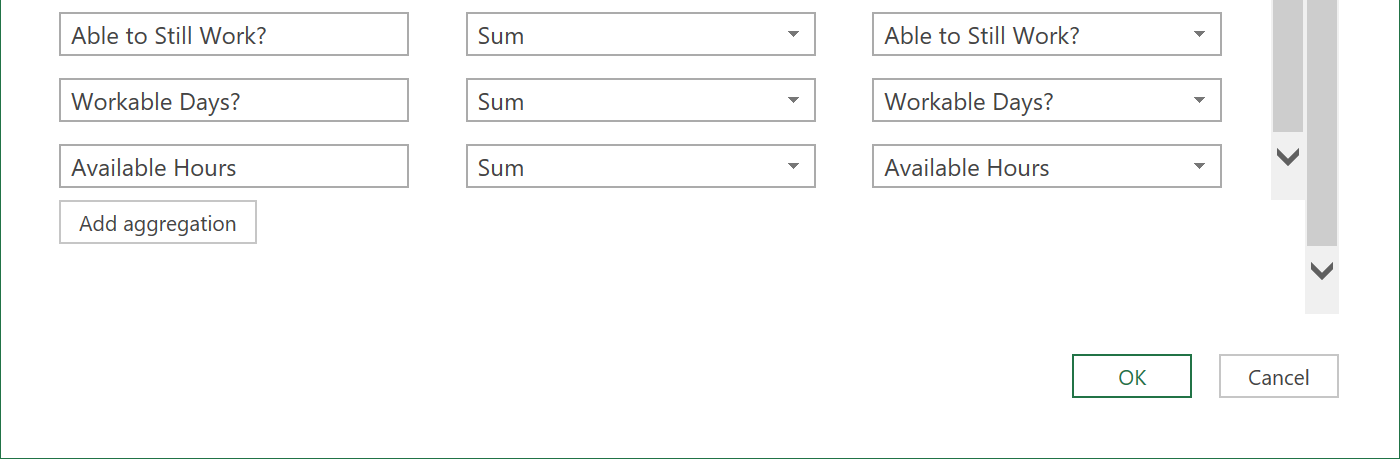
- Apply the following Group By Operation, to group the data by week:
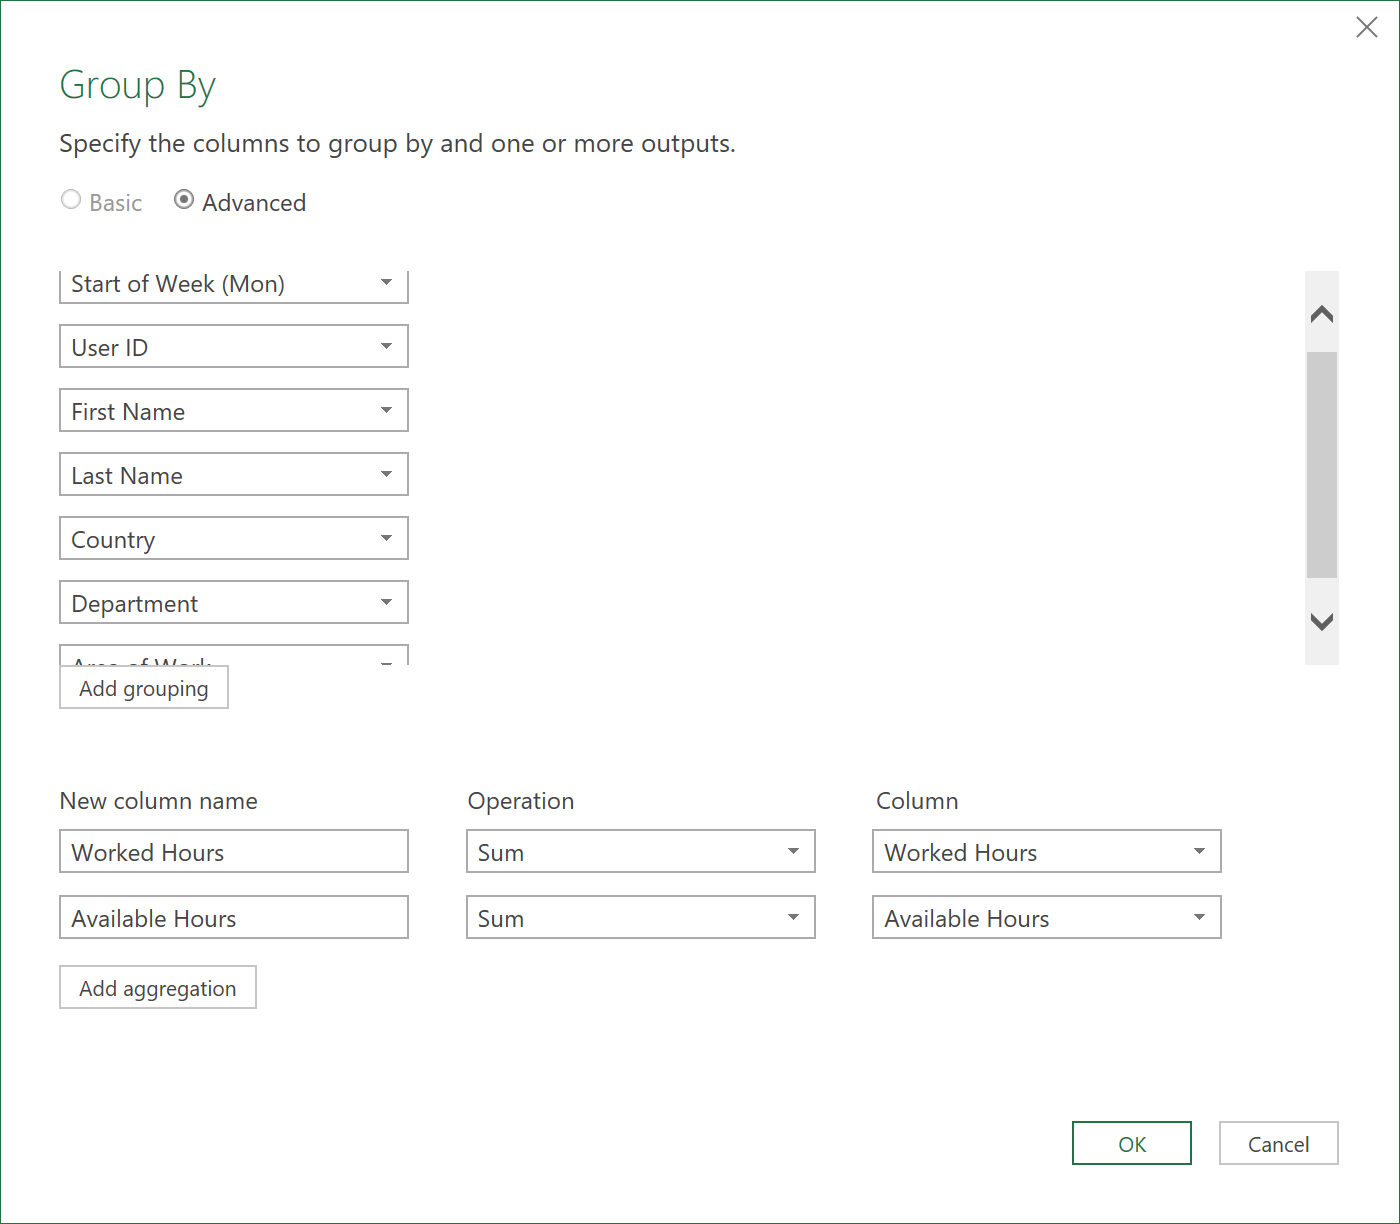
(The last group by field, which you cannot quite see is called ‘Area of Work’)
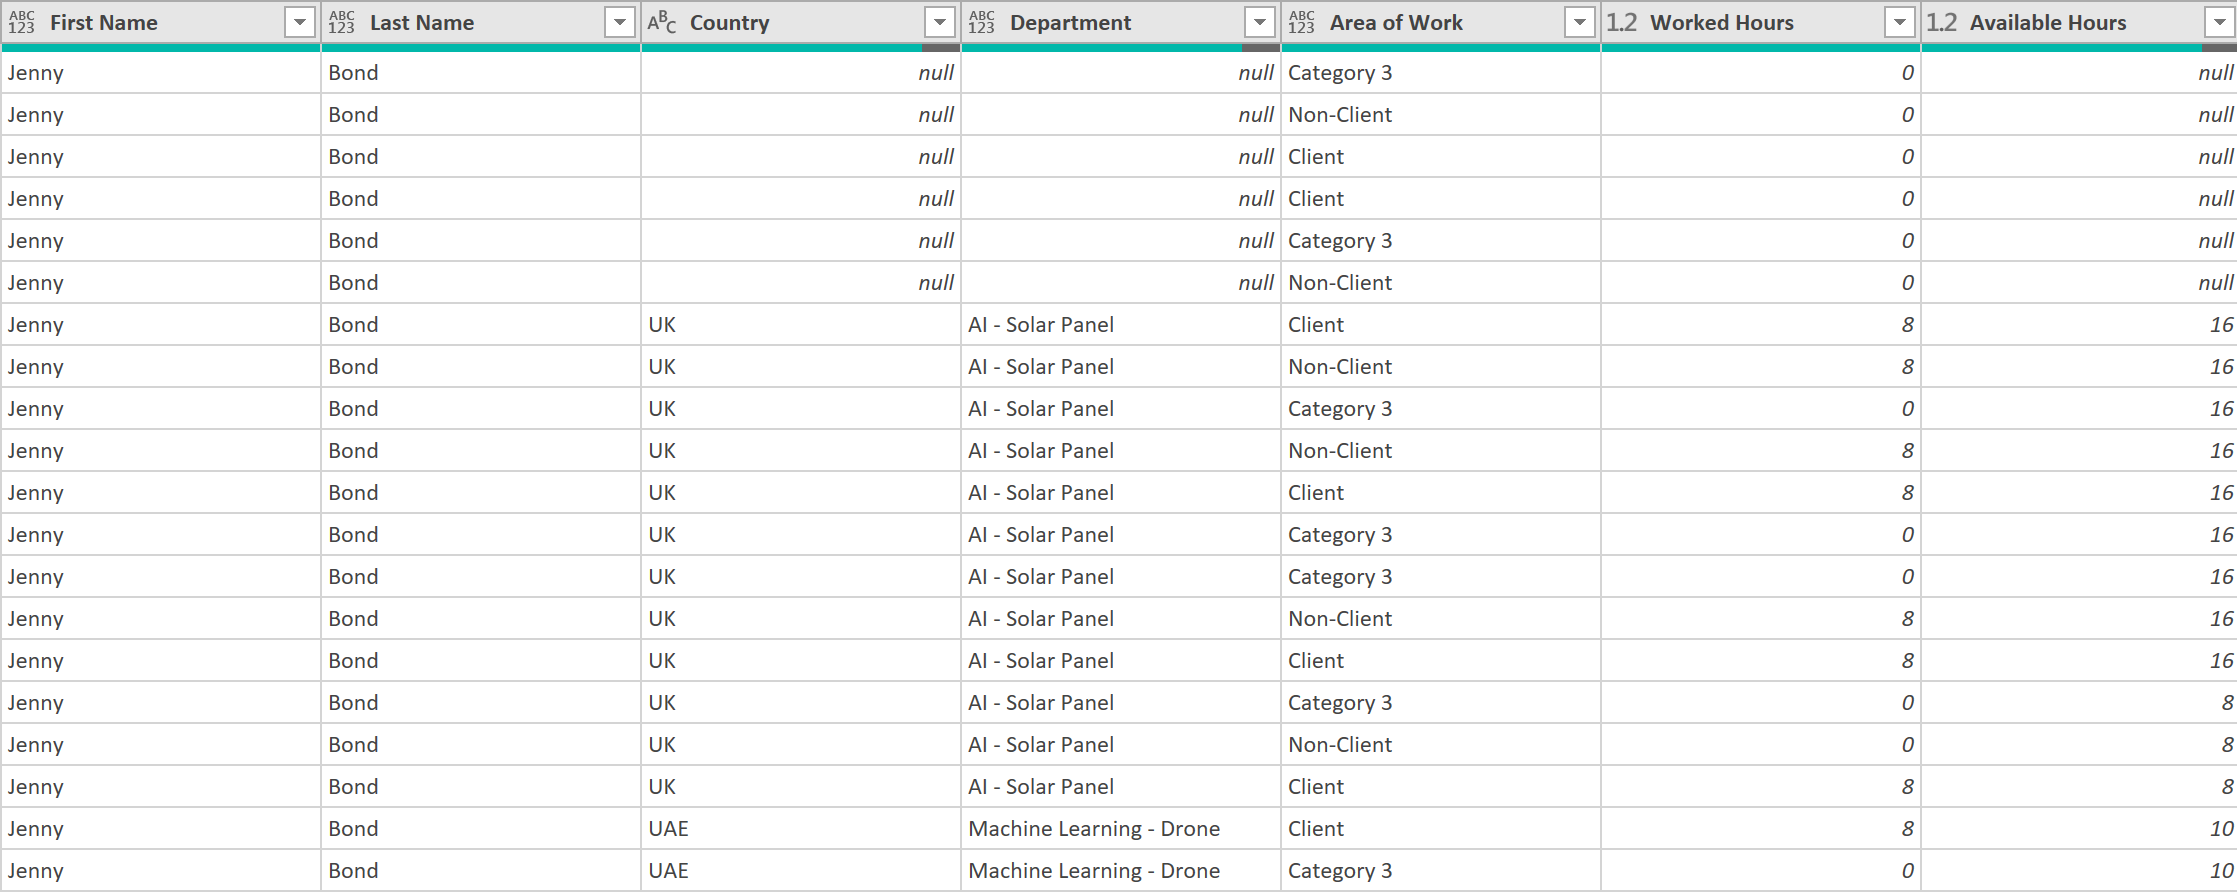
The data should now, finally, look something like this!
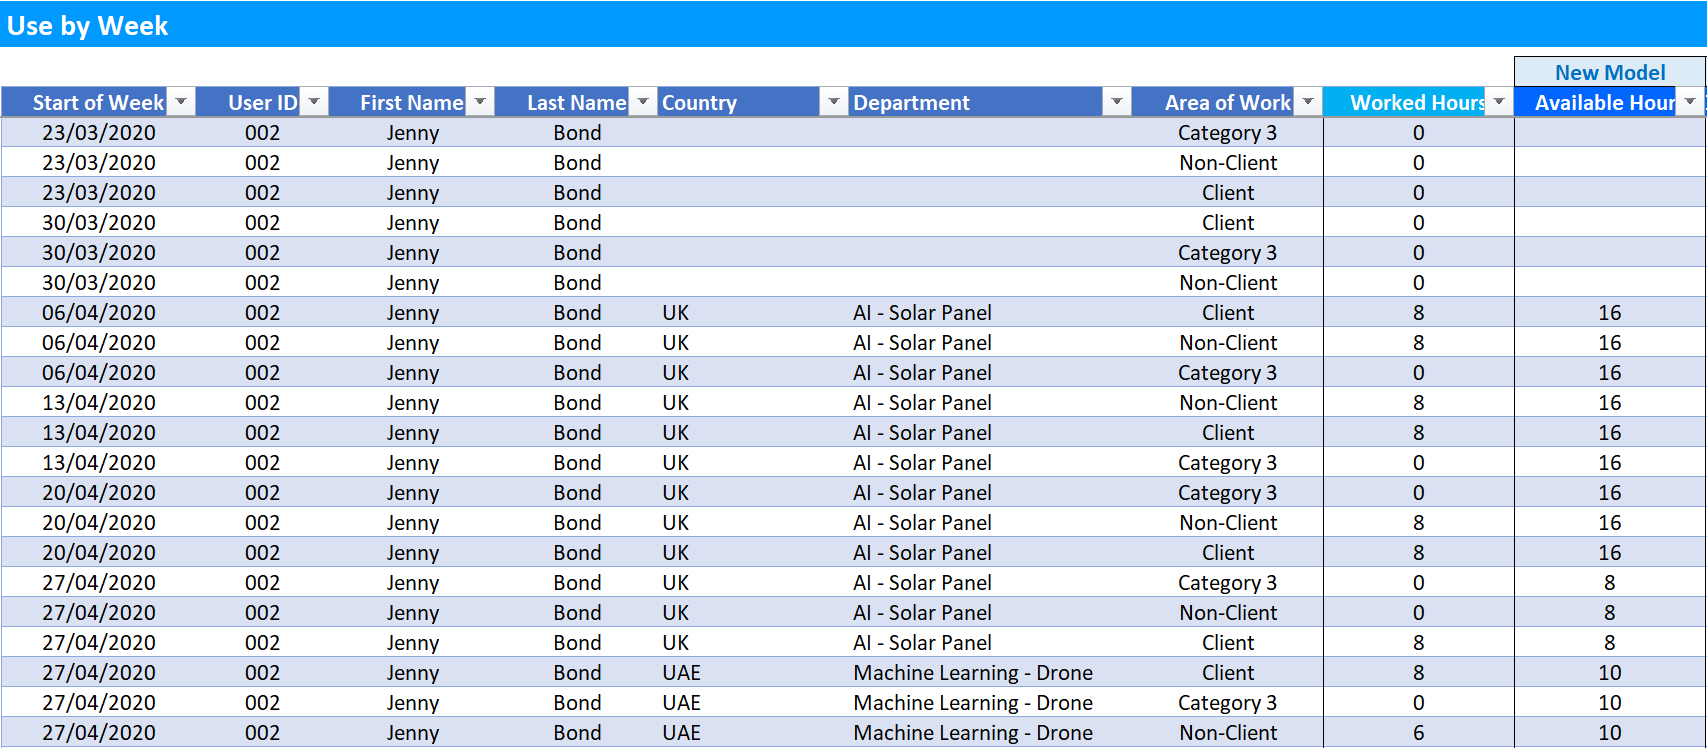
- Hit ‘Close and Load’, to load the data into an excel worksheet
The Inventory use, along with Availability by week, in hours, for each Employee should then look something like this, with both Use in Hours per day, and Availability in Hours for the given week, shown side by side.
So not as trivial as we first thought – but at least we have an accurately processed dataset now!
- The final ETL code of this query should look something like this:
let
    Source = Excel.CurrentWorkbook(),
    Inventory_Use = Source{[Name="Inventory_Use"]}[Content],
    #"Filtered Rows" = Table.SelectRows(Inventory_Use, each ([Column3] <> null)),
    #"Removed Columns" = Table.RemoveColumns(#"Filtered Rows",{"Column1"}),
    #"ReplacedNullandBlanks" = List.Transform(Table.ColumnNames(#"Removed Columns"), each {_, (_) => if _ = null or _ = "" then 0 else _}),
    #"TransformColumns" = Table.TransformColumns(#"Removed Columns", #"ReplacedNullandBlanks"),
    #"Promoted Headers" = Table.PromoteHeaders(TransformColumns, [PromoteAllScalars=true]),
    #"Unpivoted Other Columns" = Table.UnpivotOtherColumns(#"Promoted Headers", {"User ID", "First Name", "Last Name", "Area of Work"}, "Attribute", "Value"),
    #"Filtered Rows1" = Table.SelectRows(#"Unpivoted Other Columns", each Text.Contains([Attribute], "/")),
    #"Changed Type" = Table.TransformColumnTypes(#"Filtered Rows1",{{"Attribute", type datetime}}),
    #"Renamed Columns" = Table.RenameColumns(#"Changed Type",{{"Attribute", "Date"}}),
    #"Changed Type1" = Table.TransformColumnTypes(#"Renamed Columns",{{"Date", type date}, {"Value", type number}}),
    #"Renamed Columns1" = Table.RenameColumns(#"Changed Type1",{{"Value", "Worked Hours"}}),
    #"Inserted Start of Week (Mon)" = Table.AddColumn(#"Renamed Columns1", "Start of Week (Mon)", each Date.StartOfWeek([Date], Day.Monday), type date),
    #"Merged Queries" = Table.NestedJoin(#"Inserted Start of Week (Mon)", {"Date", "User ID"}, #"Availability - Daily", {"Dates", "User ID"}, "Availability_Daily", JoinKind.LeftOuter),
    #"Expanded Availability_Daily" = Table.ExpandTableColumn(#"Merged Queries", "Availability_Daily", {"Available Hours", "Country", "Department"}, {"Available Hours", "Country", "Department"}),
    #"Sorted Rows1" = Table.Sort(#"Expanded Availability_Daily",{{"User ID", Order.Ascending}, {"Date", Order.Ascending}, {"Country", Order.Ascending}, {"Department", Order.Ascending}}),
    #"Buffered Table" = Table.Buffer(#"Sorted Rows1"),
    #"Grouped Rows" = Table.Group(#"Buffered Table", {"Start of Week (Mon)", "User ID", "First Name", "Last Name", "Country", "Department", "Area of Work"}, {{"Worked Hours", each List.Sum([Worked Hours]), type nullable number}, {"Available Hours", each List.Sum([Available Hours]), type nullable number}})
in
    #"Grouped Rows"
Create a Data Model to show Inventory Utilisation
- With the final dataset from above, an Inventory Utilisation table and chart can now be created, like shown below:
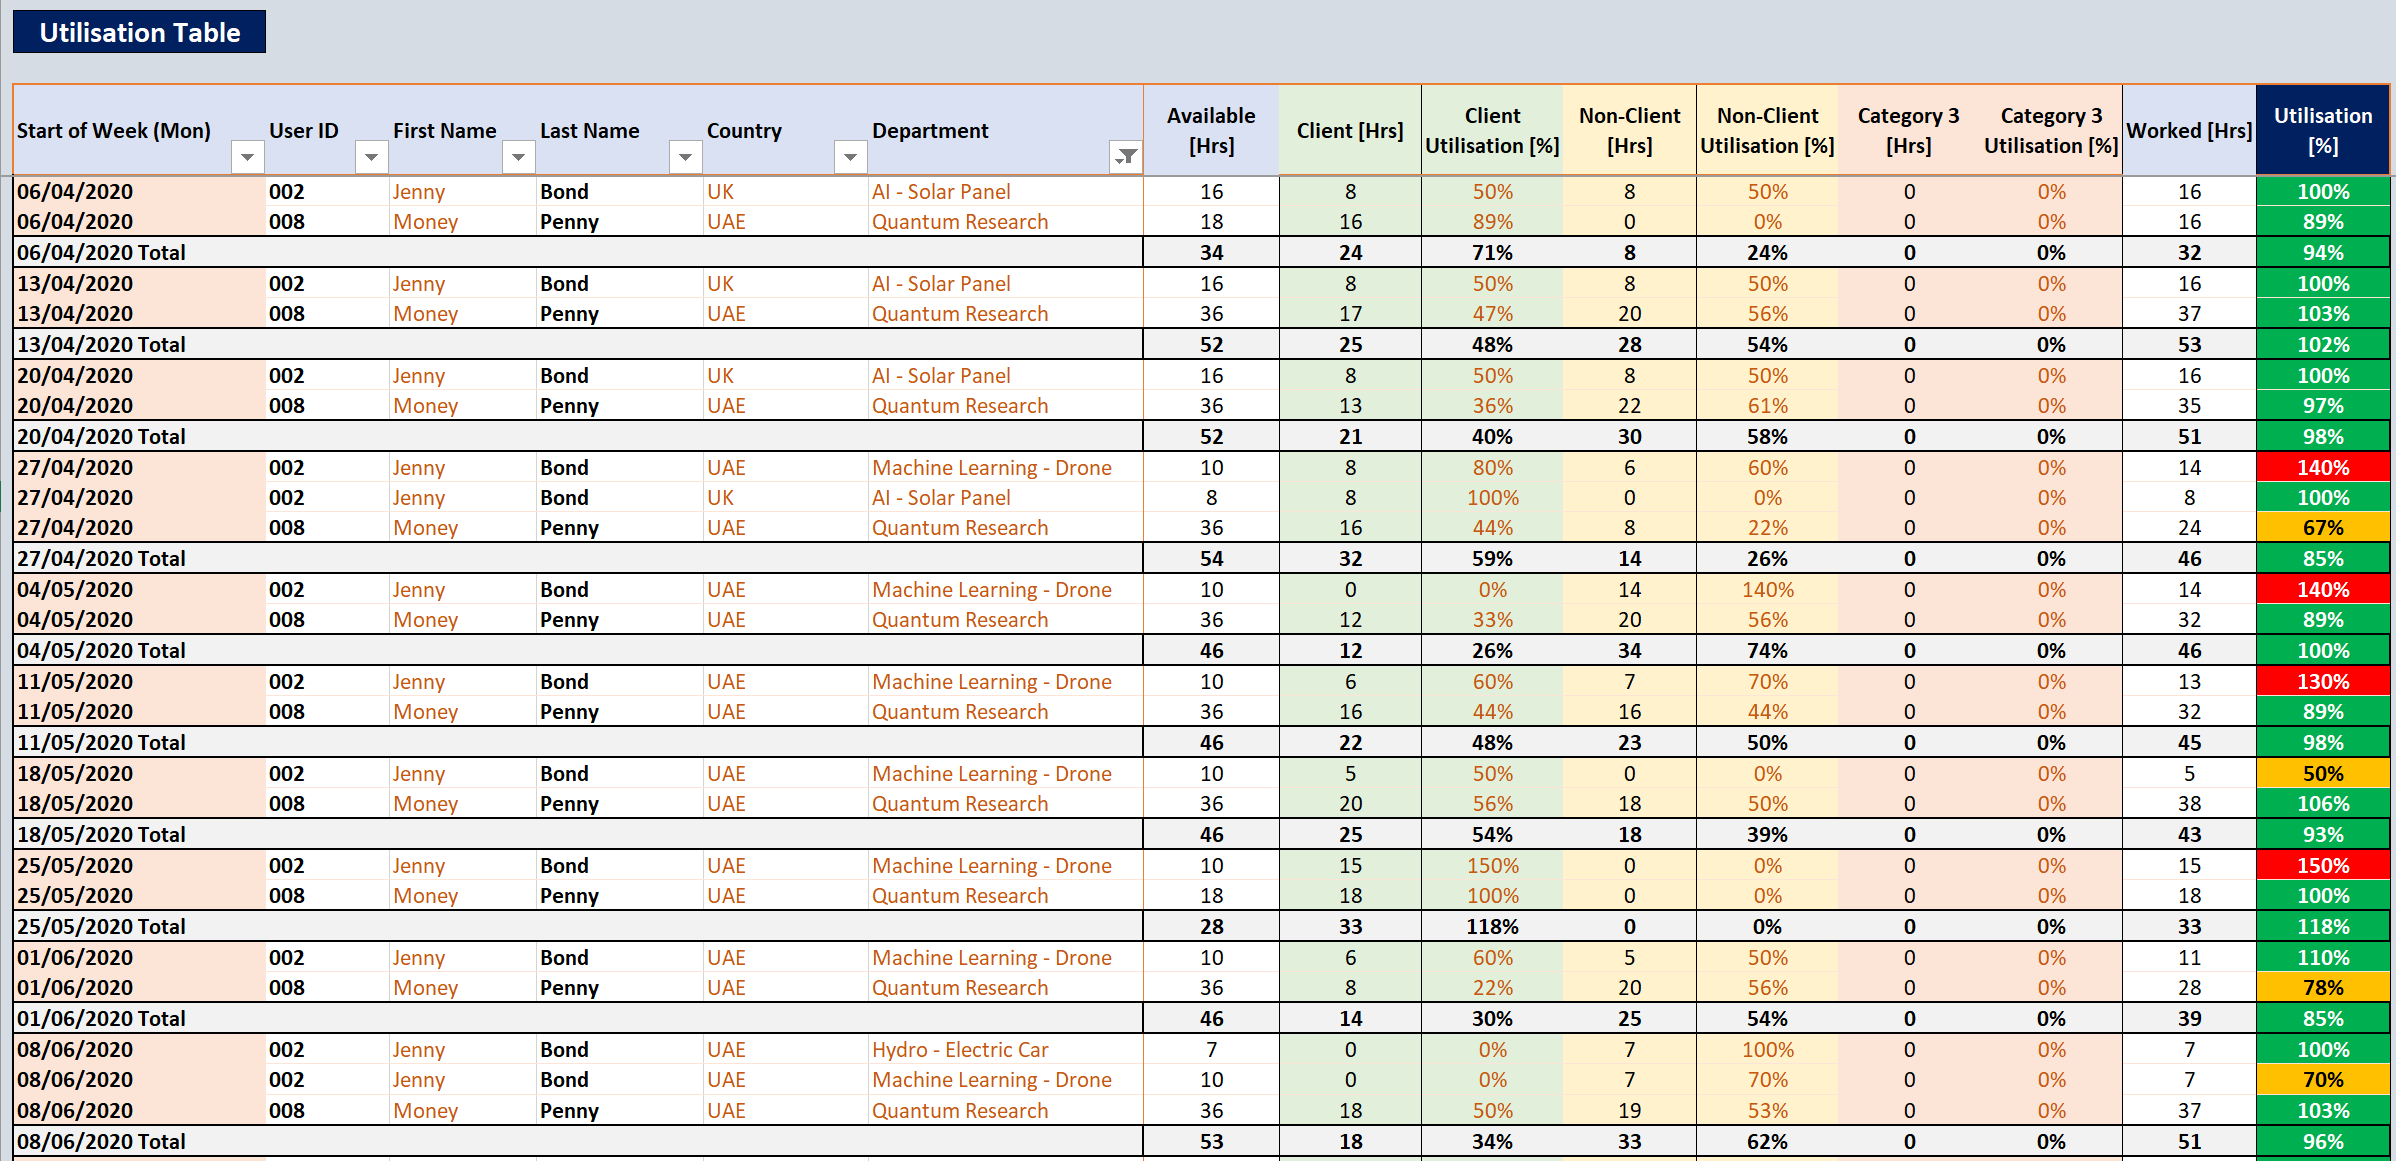
Click to view large-sized image
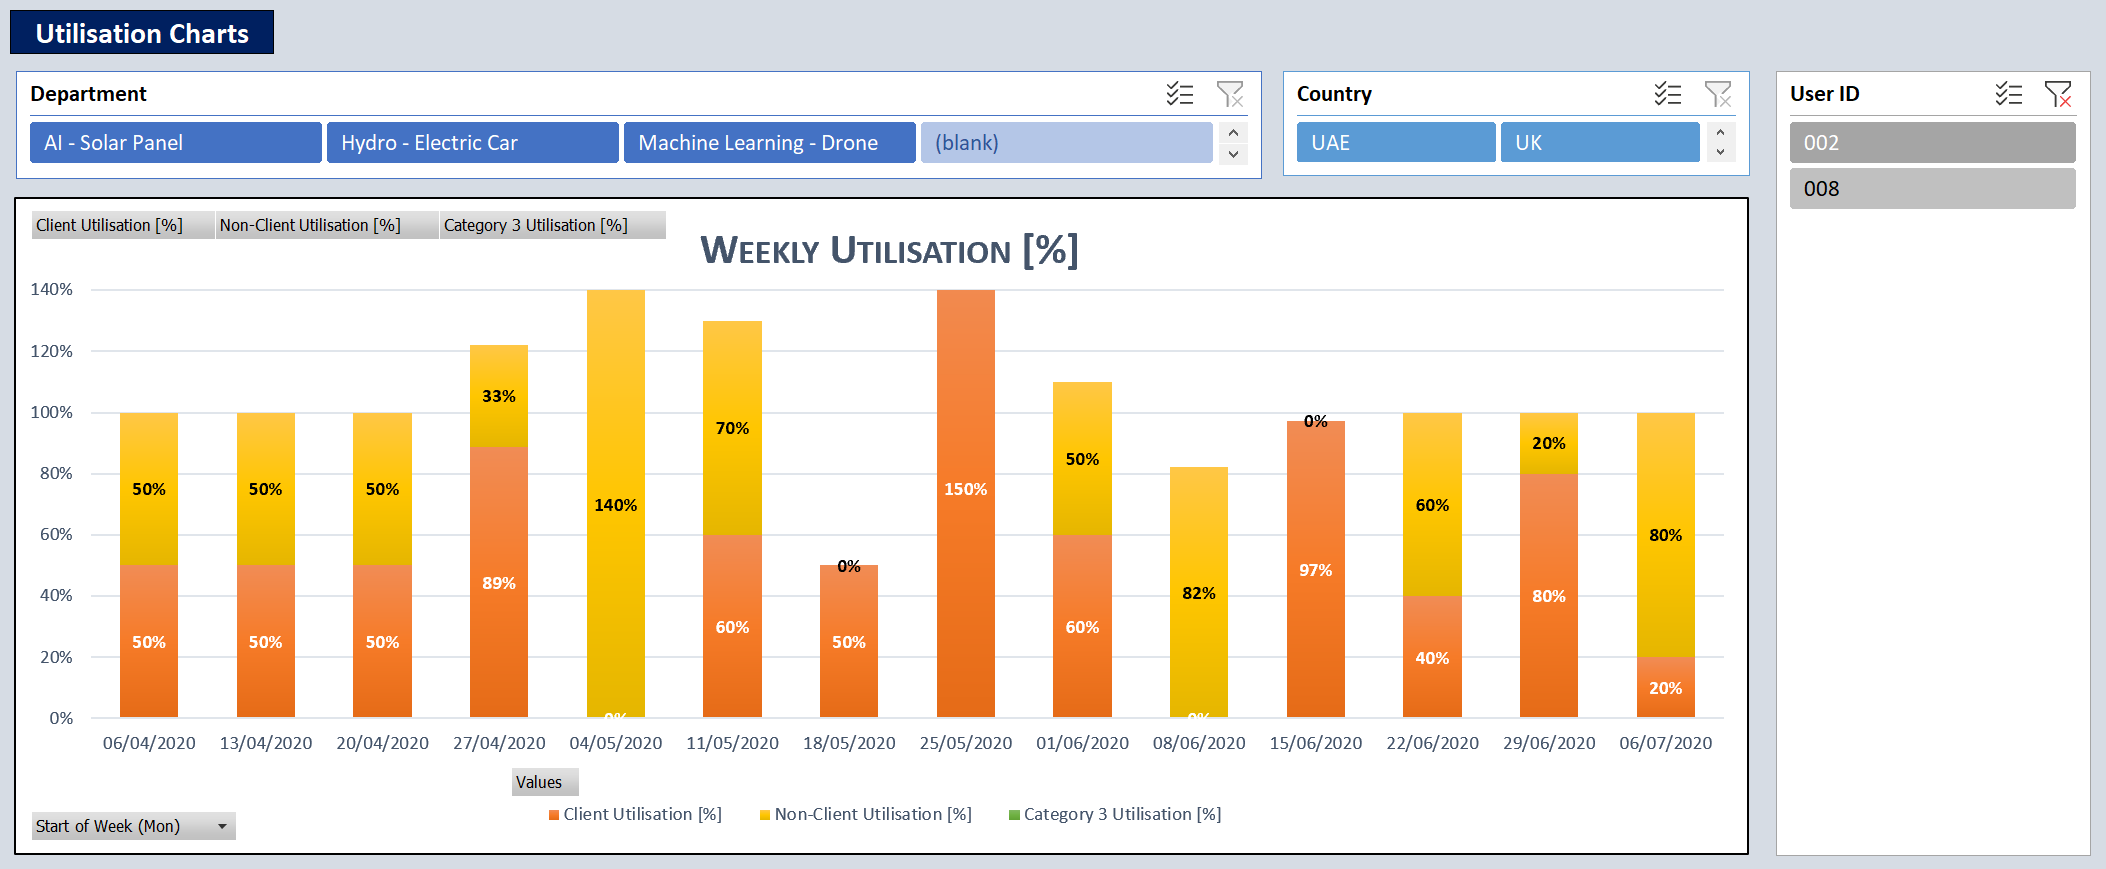
Click to view large-sized image
- A report showing Inventory Utilisation for each Employee, from the above data, can be found in this DAX article: Showing HR Inventory Utilisation over time.
ETL Extensions & Adaptations
Note, possible extensions to this ETL, could include:
- Showing Utilisations on a Monthly level, or, if needed, Hourly level (for example, if you wanted to see what utilisations looked like for Day and Overnight shift work)
- Adding ‘Job Grade’, ‘Office’, and ‘Freelance or Permanent’ as extra fields, in addition to ‘Country’ and ‘Department’, to each Employee’s record in the Availability data (if supported by your company ERP)
- Adding extra fields, such as ‘Project Code’, ‘Internal Codes’, and ‘Status Codes’ to the Timesheet data, to get more accurate and granular timesheet tracking (again, if supported by your company ERP)
- Consideration of ‘Annual Leave’, and ‘Toil hours’ on Availability. For past dates, these hours will probably already be on the Actual (Inventory Use) Timesheet, so can be taken from they. For future dates, these hours may not be on the Timesheet, and so may need to be obtained from a separate ‘Annual Leave’ report.
Feedback
Submit and view feedback