
Grouping Tables (to show duplicates)
Overview
In this article, we understand a technique for Grouping Tables, to show counts of any duplicates of a particular field.
Counting Duplicates and showing Joining Dates
Let us suppose we are given a list of employee records, as shown below, with their name, position, and start, and end dates, for each different position they hold.
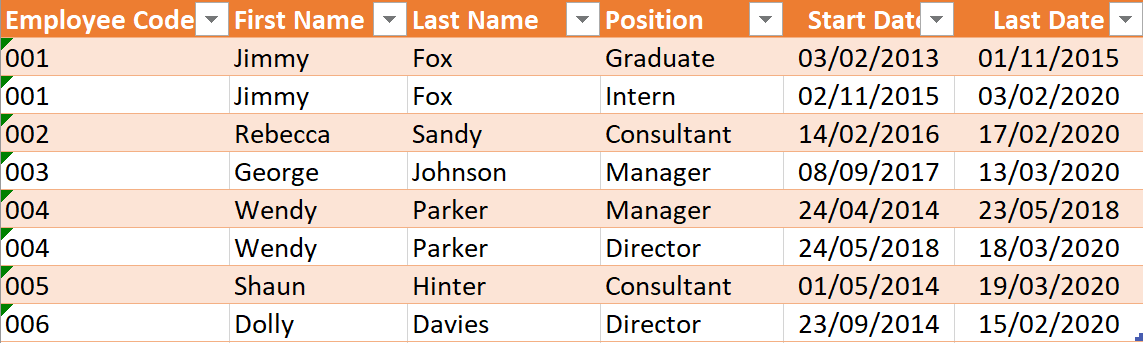
We need to do two things:
- Show a count of duplicate employees
- Show, in a separate column, the joining date of each employee (an employee’s very earliest start date)
Steps
1. Summarise the Table using Group By
- To start, load the data into Power Query
- Click the ‘Employee Code’ field ➔ go to the Home tab ➔ click the Group By icon
- Apply the following settings in the dialogue window that appears
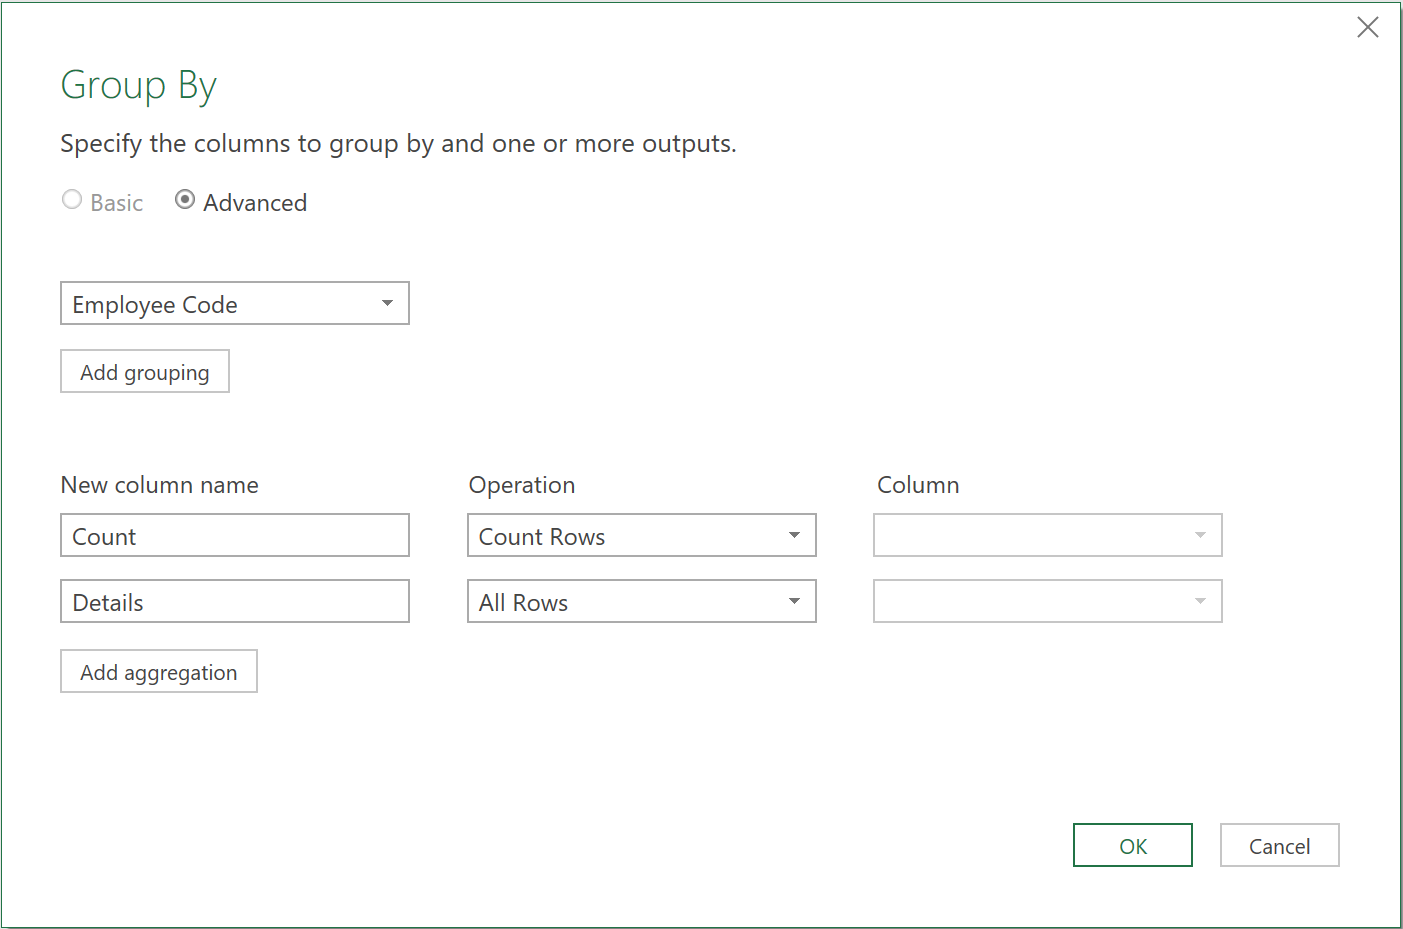
- Click the ‘Add aggregation’ button, and choose the ‘All Rows’ operation. Name the column ‘Details’.
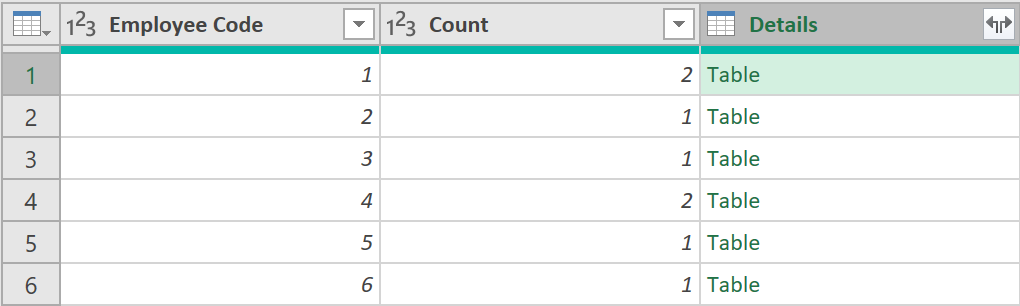
After clicking OK, you should see the following summarised table, with a Table Object added to each row.
2. Add a Custom Column
- Add a further extra column, by clicking on Custom Column in the Add Column tab
- Use the following formula to extract only the record with the lowest / earliest ‘Start Date’
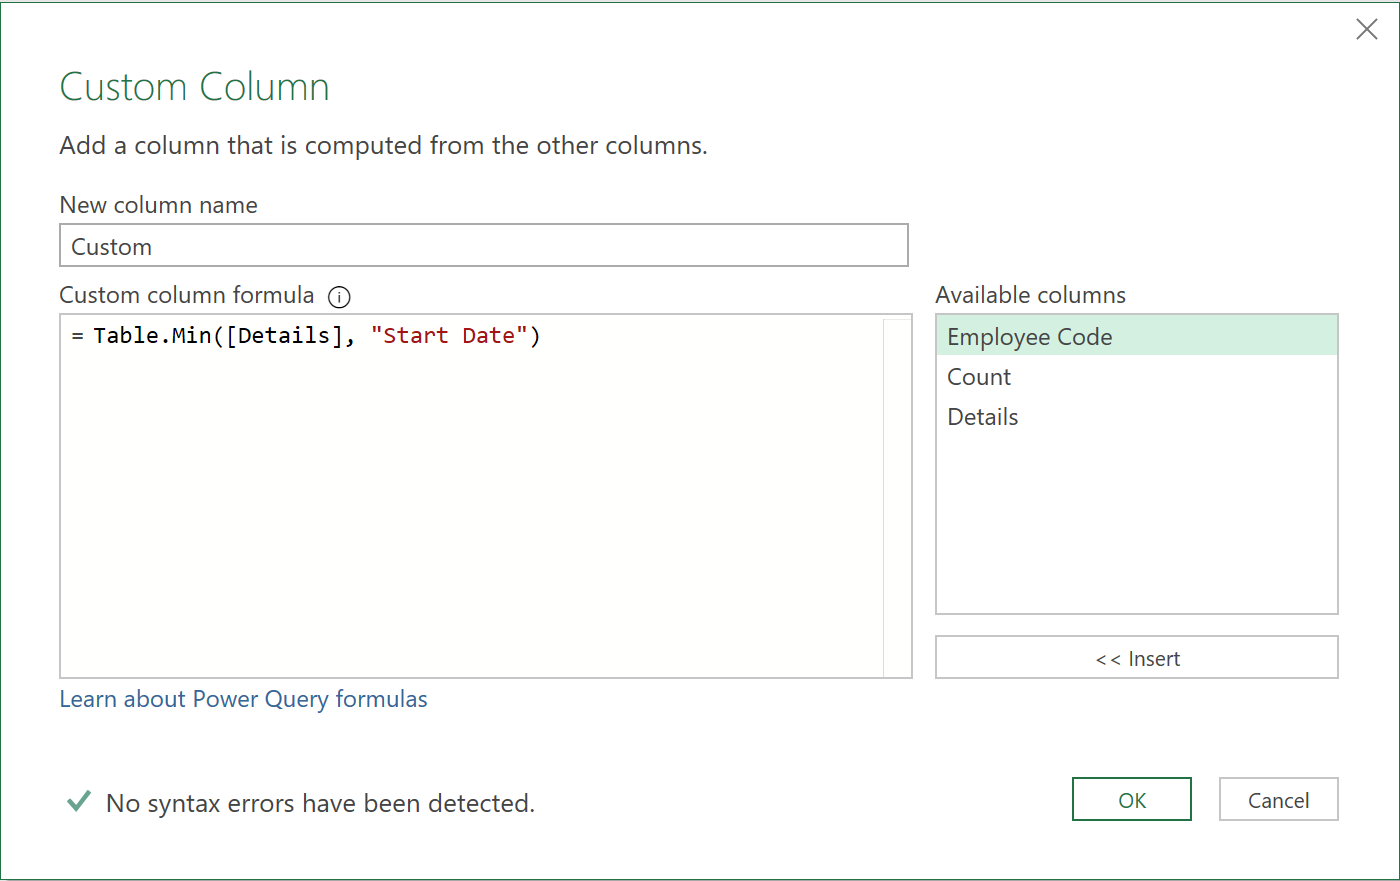
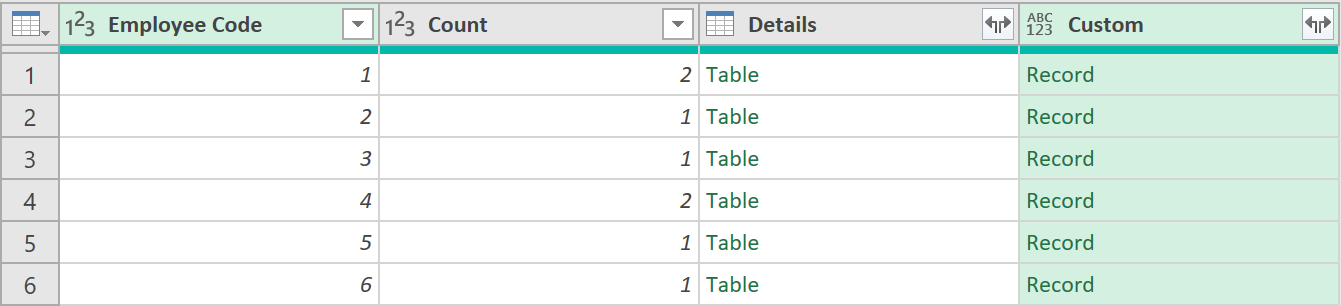
Each row will now be loaded with a Record Object, with details of the record with the earliest start date.
3. Expand the ‘Custom’ column
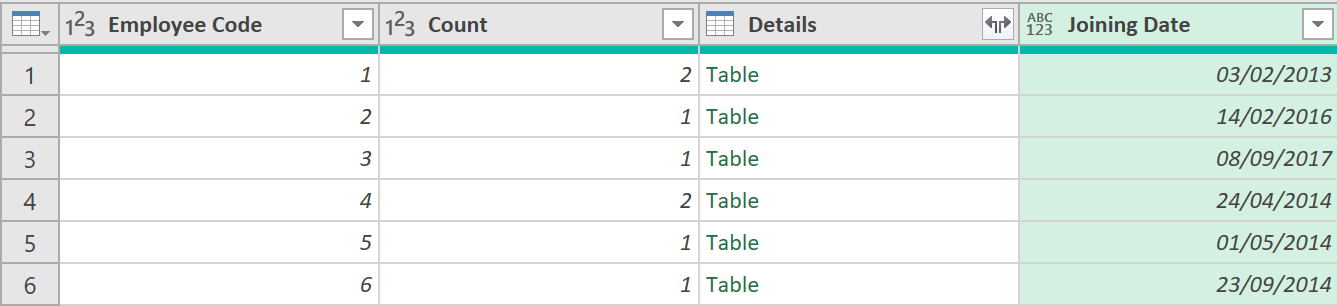
- Extract the ‘Start Date’ field from each Record object in the ‘Custom’ column
- Rename the column to ‘Joining Date’, so the Query looks as follows:
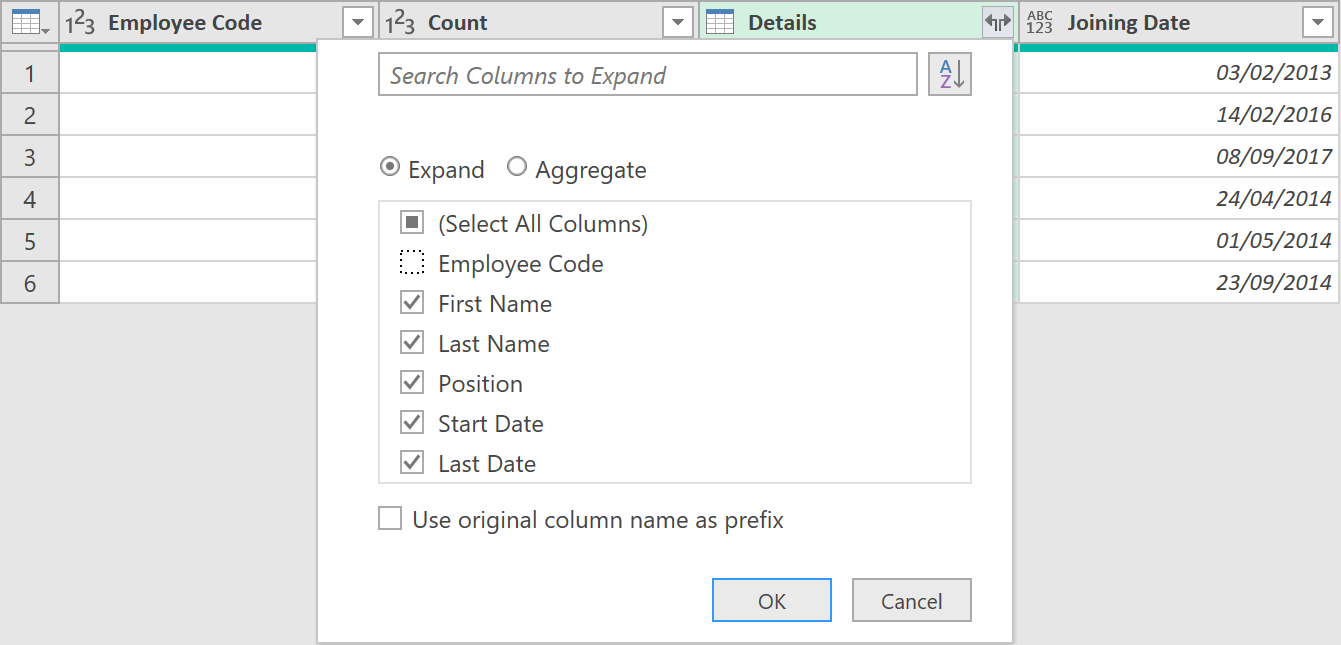
4. Expand the ‘Details’ column
- Now, extract all fields, apart from ‘Employee Code’ (as it is already in the Query) from the ‘Details’ column, as shown below:
After re-ordering the columns, you should now have the desired result: two extra columns – one showing a Count of duplicate employees (based on a count of the field: ‘Employee Code’); the other showing each employee’s original Joining Date.
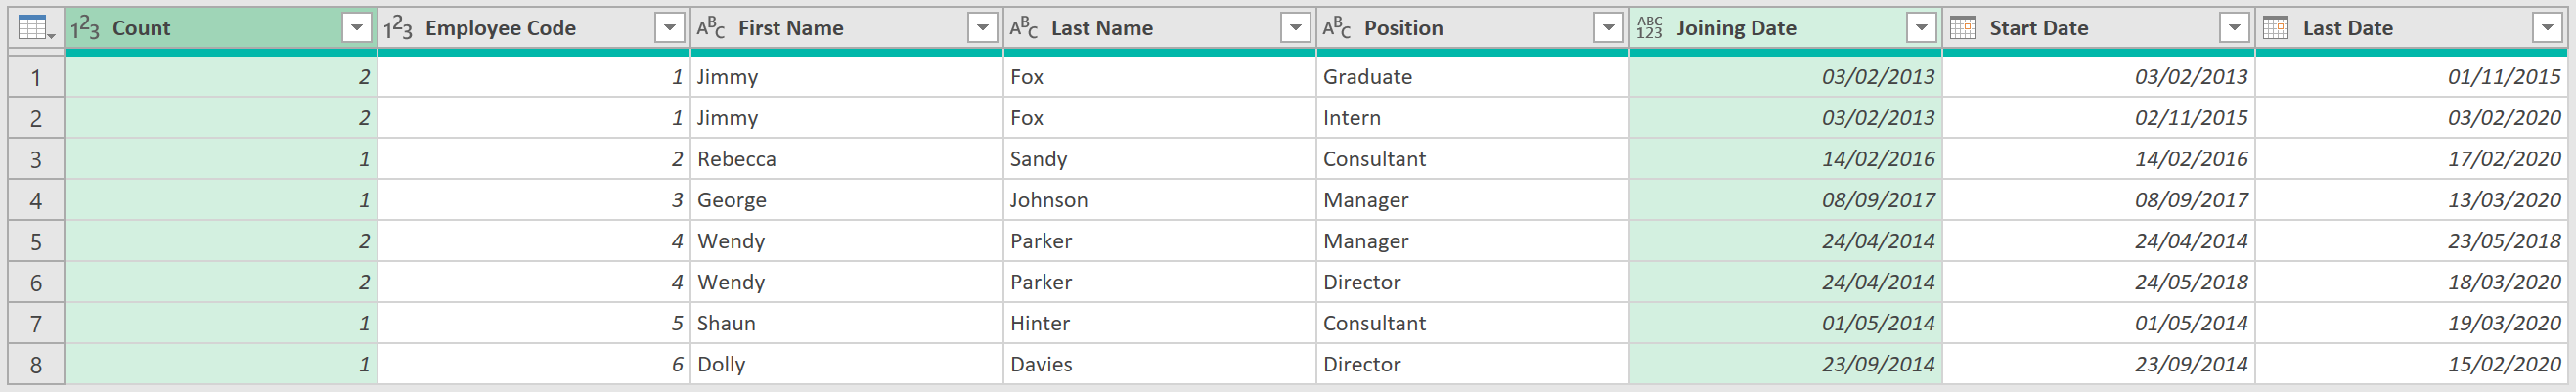
From the original joining date, other measures, such as each employee’s full tenure can now be properly calculated, and shown.
Feedback
Submit and view feedback