
Shaping vs Modelling
Overview
Power Query and Power Pivot are 2 products in the Microsoft product landscape that are closely related to each other, built for Self Service Business Intelligence, however both can also be a little confusing - so this article tries to explain some of the main differences:
Shaping and Modelling data
To help delineate (with language/labels) between the process of loading data, and process of modelling data, in this article we use “Shaping” as a replacement term for Power Query/Get Data, and “Modelling” as a replacement term for Power Pivot.
Definition of Shaping
Shaping, in data terms, is the process of extracting data from its source and transforming it so it can be loaded elsewhere. The entire process is sometimes referred to as ETL - although ETL refers more accurately to the 3 separate stages of extracting, transforming, and loading data. Shaping is what is normally needed as the first step to any BI project. The shape of the data refers to:
- What data is extracted
- How the data is loaded into one or more tables, and which tables are imported
- What names are given to the columns and tables
- Whether tables are wide and short (many columns), and which ones long and narrow (fewer columns)
Event tables, such as Sales, or Purchases (also called fact tables) are normally best shaped into long, narrow tables (lots of rows, and a minimum number of columns). Informational assets tables, such as Customers, Products, Employees, or Patients (dimension tables) can however be as wide as needed for the task.
As a matter of best practice, tables should only be loaded with the data that is actually needed.
Data Shaping
The process of shaping data includes:
- Restructuring data coming from source tables into new tables that meet the requirements for the reporting database. The table structure in a relational database is seldom (if ever) appropriate a tool like Power BI. Don’t fall into the trap of just loading what is in your source data.
- Selecting only the columns and rows that are needed. Load everything you need, and nothing you don’t. It’s easy to make changes later if needed.
- Pre-aggregating data, if desired, though not recommended, sometimes this can be useful.
- Naming/renaming the columns and tables to be business user friendly.
- Loading everything into the Power BI database (a data model).
Where possible, it is better to do this shaping work inside views in a relational database (if you have one). If this is not possible for any reason, Power Query is there to do this work for you.
Definition of Modelling
Modelling as distinct from Shaping, is the process of building relationships between tables and converting business requirements into measures and calculated columns, for example, using a language such as DAX. These measures and calculated columns contain:
- The business logic that transforms raw data into a usable, value adding calculation
- The formatting required for numbers (e.g. currency, percentage, whole numbers, integers, dates)
- A good business name that accurately describes what each measure shows
Before Self Service Business Intelligence, data modelling was always done by expert IT professionals using a complex language like MDX. The complexity of such languages then put it very far out of reach of users, as it was too hard to learn casually. DAX helps to overcome some of these past usabilty challenges.
Data Modelling
Data modelling includes:
- Deciding what data to load and what to not load.
- Deciding on a table schema; one table, two tables, many tables? A star schema is always preferred.
- Joining tables using relationships (where needed)
- Writing the business logic in measures to extract the value adding insights from your raw data.
- Correctly formatting measures and columns to meet the business requirements (e.g. currency, percentage, appropriate number of decimals)
- Assigning good business names to the measures that accurately describes what is being calculated.
The decision on what to load is part of modelling, but the process of structuring the data is part of shaping. Both concepts are closely linked and are mutually dependent.
Things Are Not Always Clear Cut
One thing that creates a lot of confusion for new Power BI users is that there are at least 2 ways to add columns to data. You can add a column using Power Query or you can add a calculated column using DAX. It may be possible for a third way; add the data back at the source database instead. Regardless of which method you use, the decision on whether to add the column (or not), and what should be in the column, is a data modelling decision. It is debatable if the process of actually adding a calculated column is shaping or modelling, but it is probably a shaping task.
Two ways to add columns
A good example of the type of confusion BI first timers often face is how to add columns to their data. For example, you can add a column during the shaping process, but you can also add a column during the modelling process.
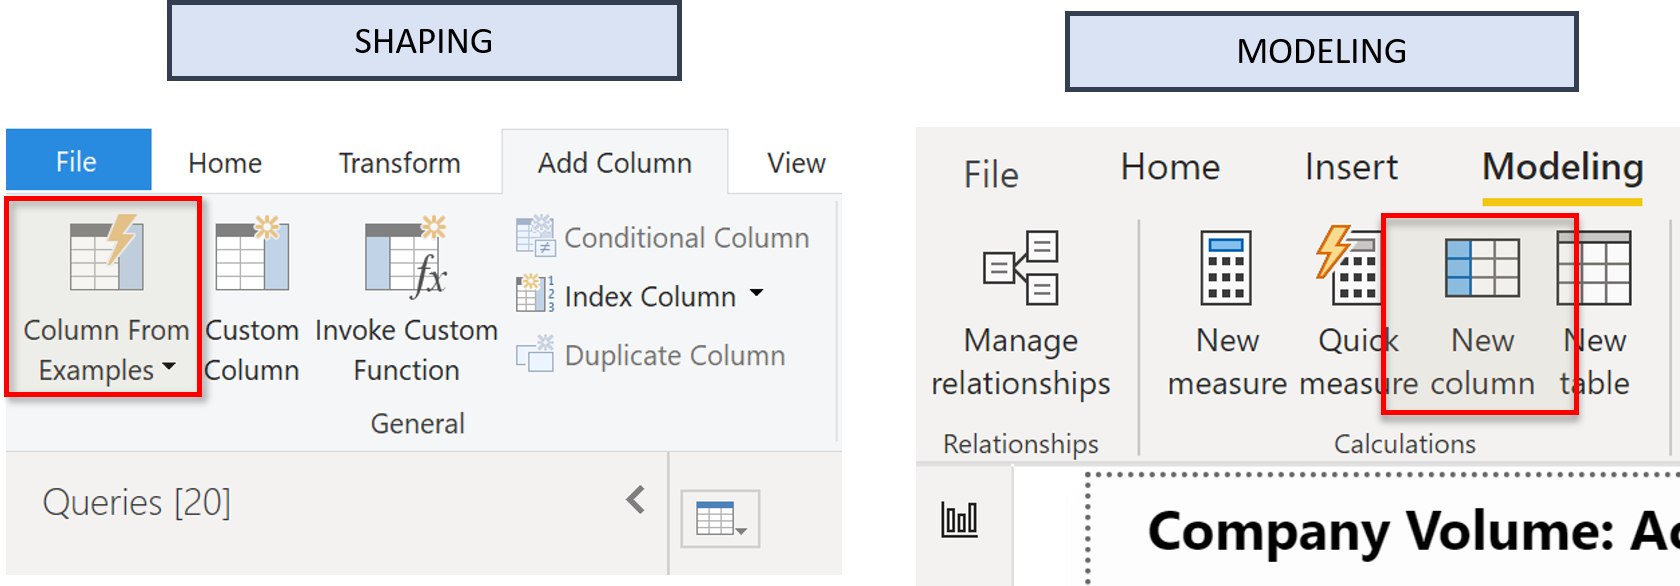
Which method you use depends on what you are trying to do. It is usually recommended to add columns to tables to make the change as close to the source as possible. So, in order of preference, you would do this:
- Add the column in your source data (e.g. your Data Warehouse) - with the help of your IT friends if necessary
- Add the column during the shaping process (Power Query)
- Add the column during the modelling process (Power Pivot)
If you add the column at the source, then you have access to it for your current BI (Power Pivot) needs but also for future BI needs. Adding the column at the source provides the most reuse, and if you need to make a change down the track, it will be the least maintenance. But sometimes you cannot do that for various reasons, or you cannot do it quickly, so, often this is not an option particularly for self service BI.
If you add the column during shaping, it will be loaded and compressed with all other columns during data load. This normally means better overall table compression and hence a good outcome for the overall model. It also keeps all the shaping tasks together, which can make it more intuitive to find things and easier to maintain.
The most common reason you would add a column during the modelling process is if you needed to leverage other parts of the model to create the data. An example here would be if you wanted to use a measure (e.g. Total Sales) in your data model to create a new column in the model (e.g. Banded groups of Customers based on High, Med, Low annual sales).
If you tried to do this task inside Power Query, it would be quite some additional work. You would have to work out the total sales for each customer in Power Query, and that would require you to:
- Create a join between the customer table and the sales table
- Pre-aggregate the sales data for each customer
- Group the customers into the size bands using the business logic you need
- Add the column (high, medium, low)
Points 1 and 2 above will most likely already exist in the data model itself. Table relationships in models can be used to more easily add a new calculated column using DAX. In short, a calculated column is preferred when it leverages the logic of a model (measures and relationships), so the logic is not repeated inside Power Query.
But don’t fall into the trap of using too many calculated columns instead of writing measures.
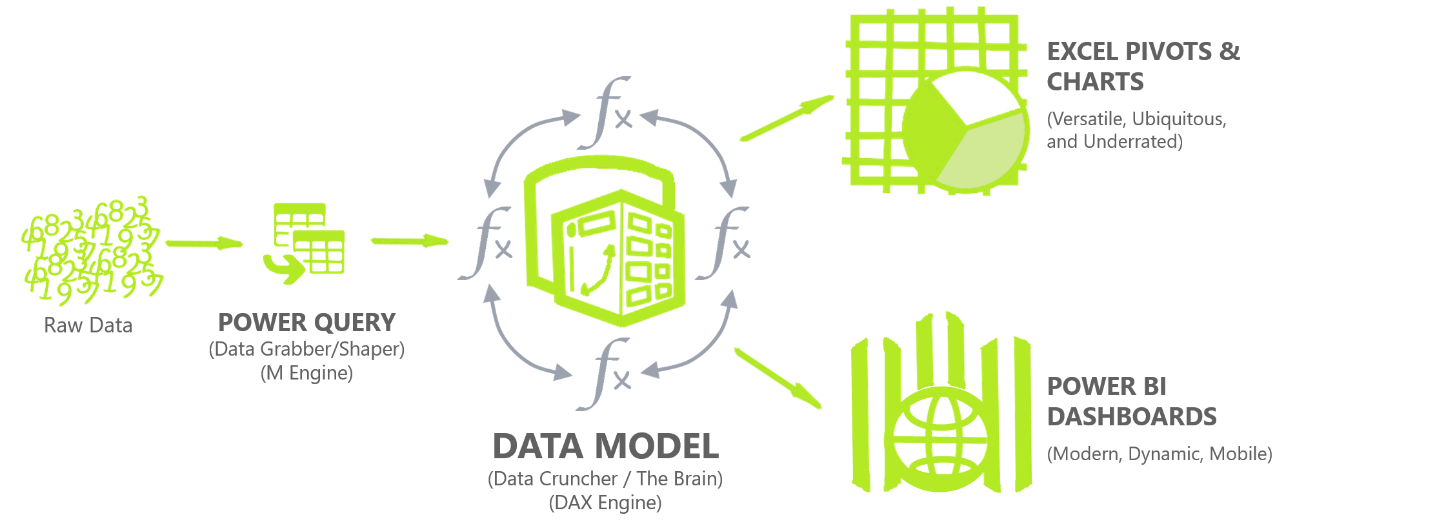
The picture below shows the broader picture of how the different technologies - Power Query, Power Pivot, and Power BI all fit together, and in what order. The Data Model is commonly referred to as Power Pivot, and the Dashboarding tool, Power BI.
Hopefully, this gives you a better understanding of the differences between shaping and modelling!
Feedback
Submit and view feedback