
Combining stacked headers
Overview
Here we understand how to combine multiple stacked header rows into a clean unpivoted dataset. This is a common scenario, for example, if data from your E.R.P. system has many data or time dependent headers, stacked in multiple rows, above the date or time headers.
For example, your ERP data might look like this, with 4 unstacked headers (“Country”, Manufacturer”, “Model”, and “Currency”), and 3 stacked headers (“Date”, “Scenario”, “System”)
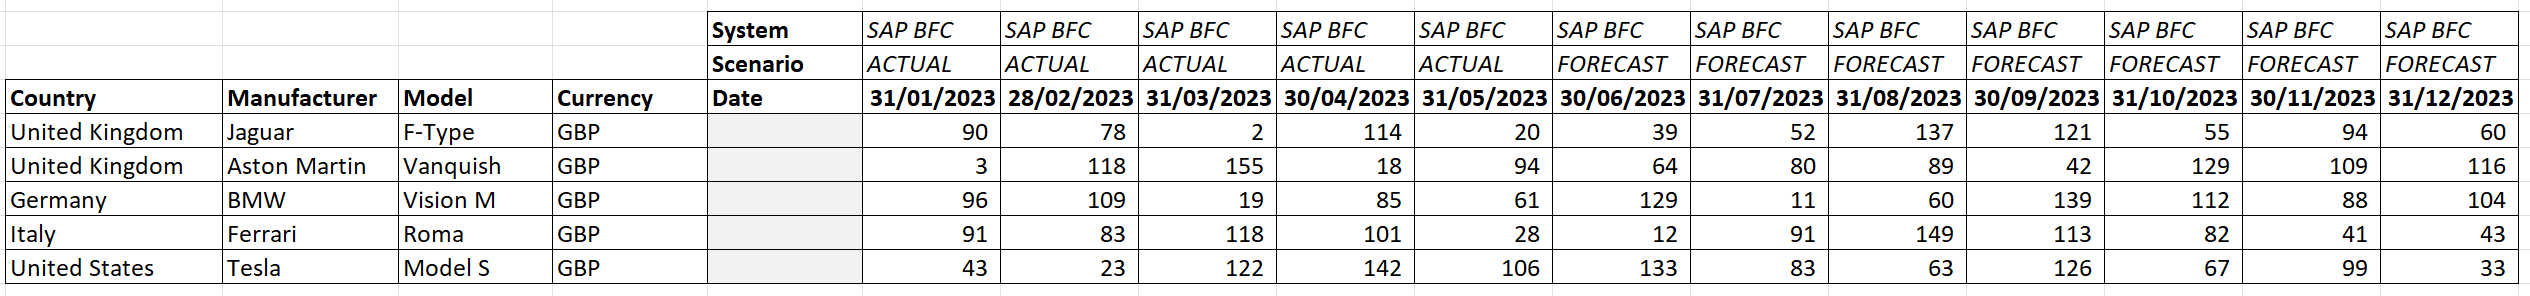
Click to view large-sized image
This article explains how to transform this data, using ‘M’-code, into an unpivoted dataset that can be more easily worked with. Importantly, it handles the scenario of there being more than just 1 stacked header. (The unpivoted dataset can then be pivoted again, on any single header field)!
Steps (Running Total)
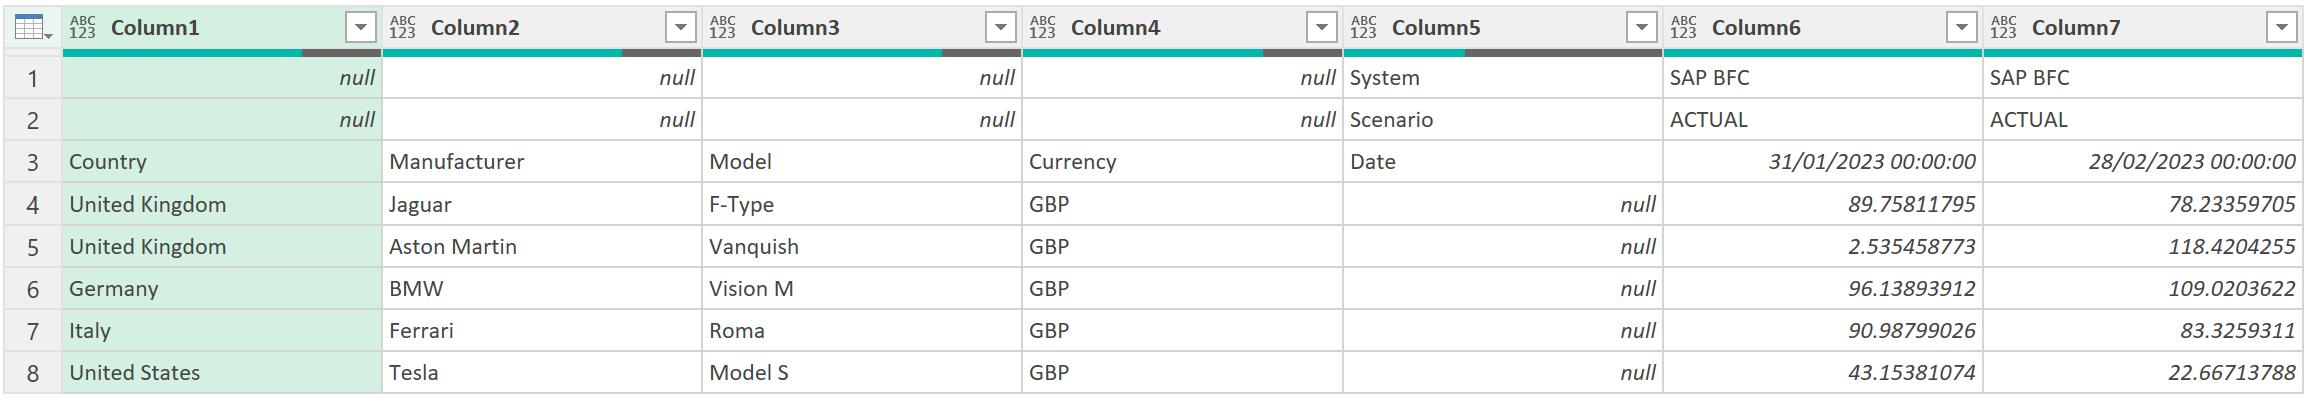
1. Load the data to Power Query
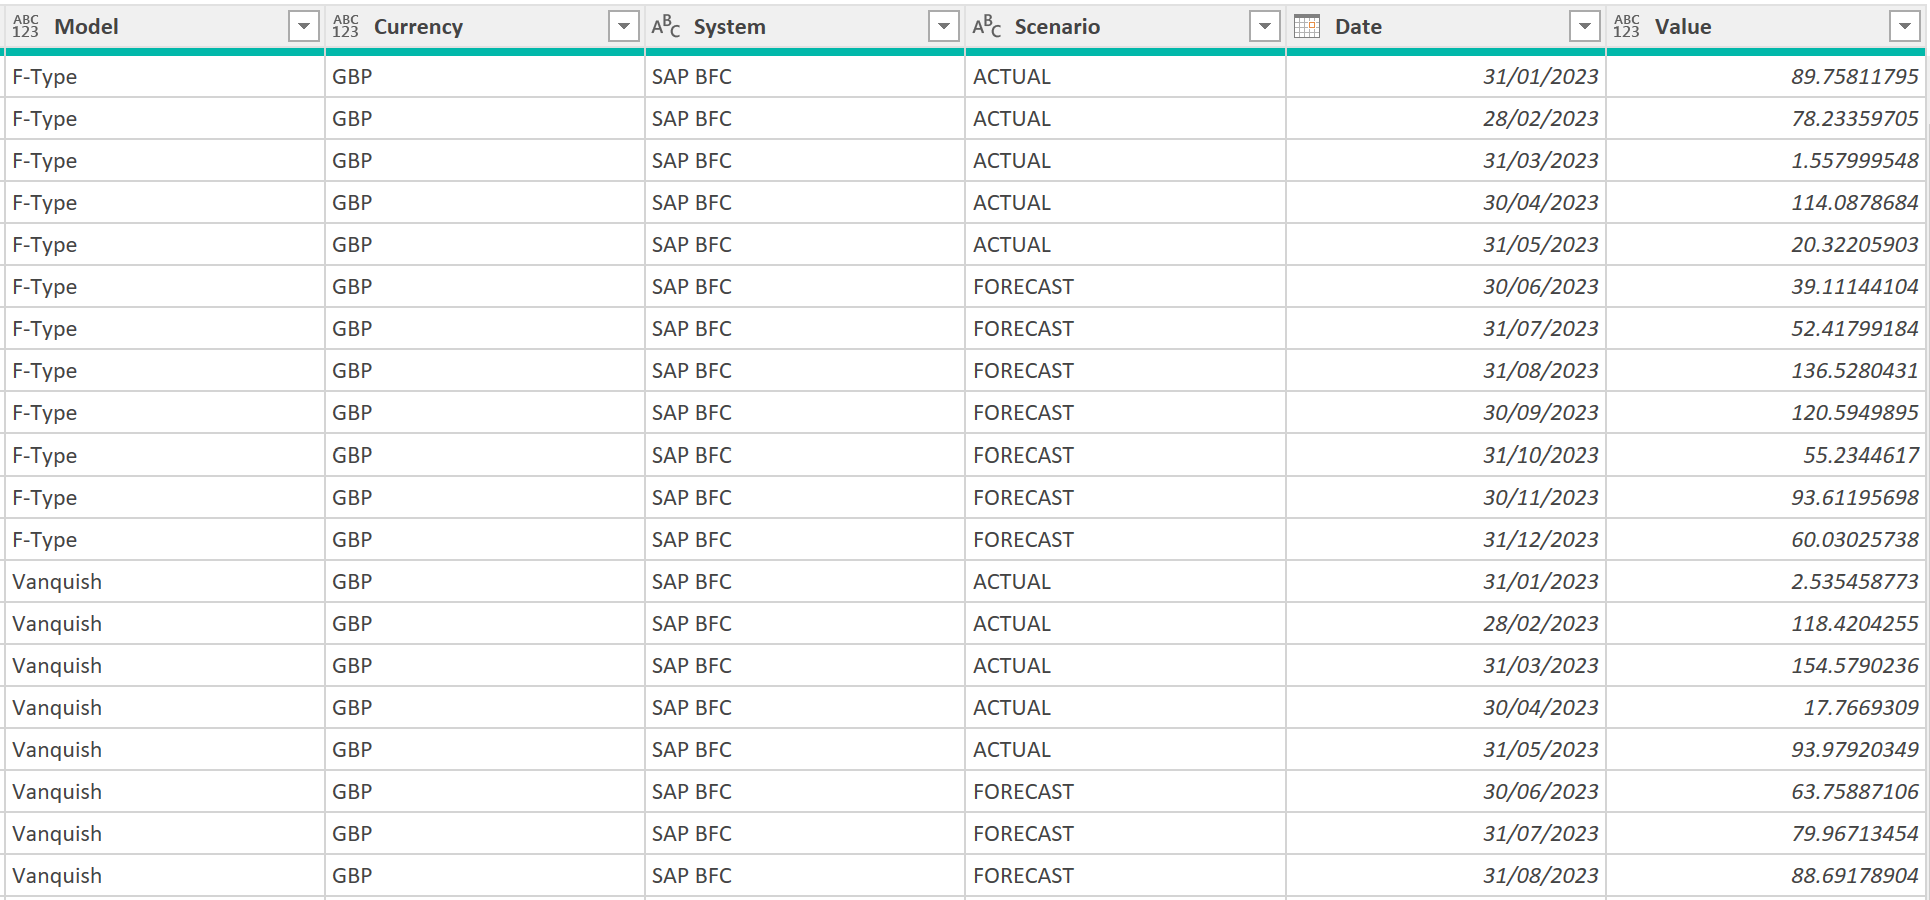
When in the query editor, the data should look as follows:
Click to view large-sized image
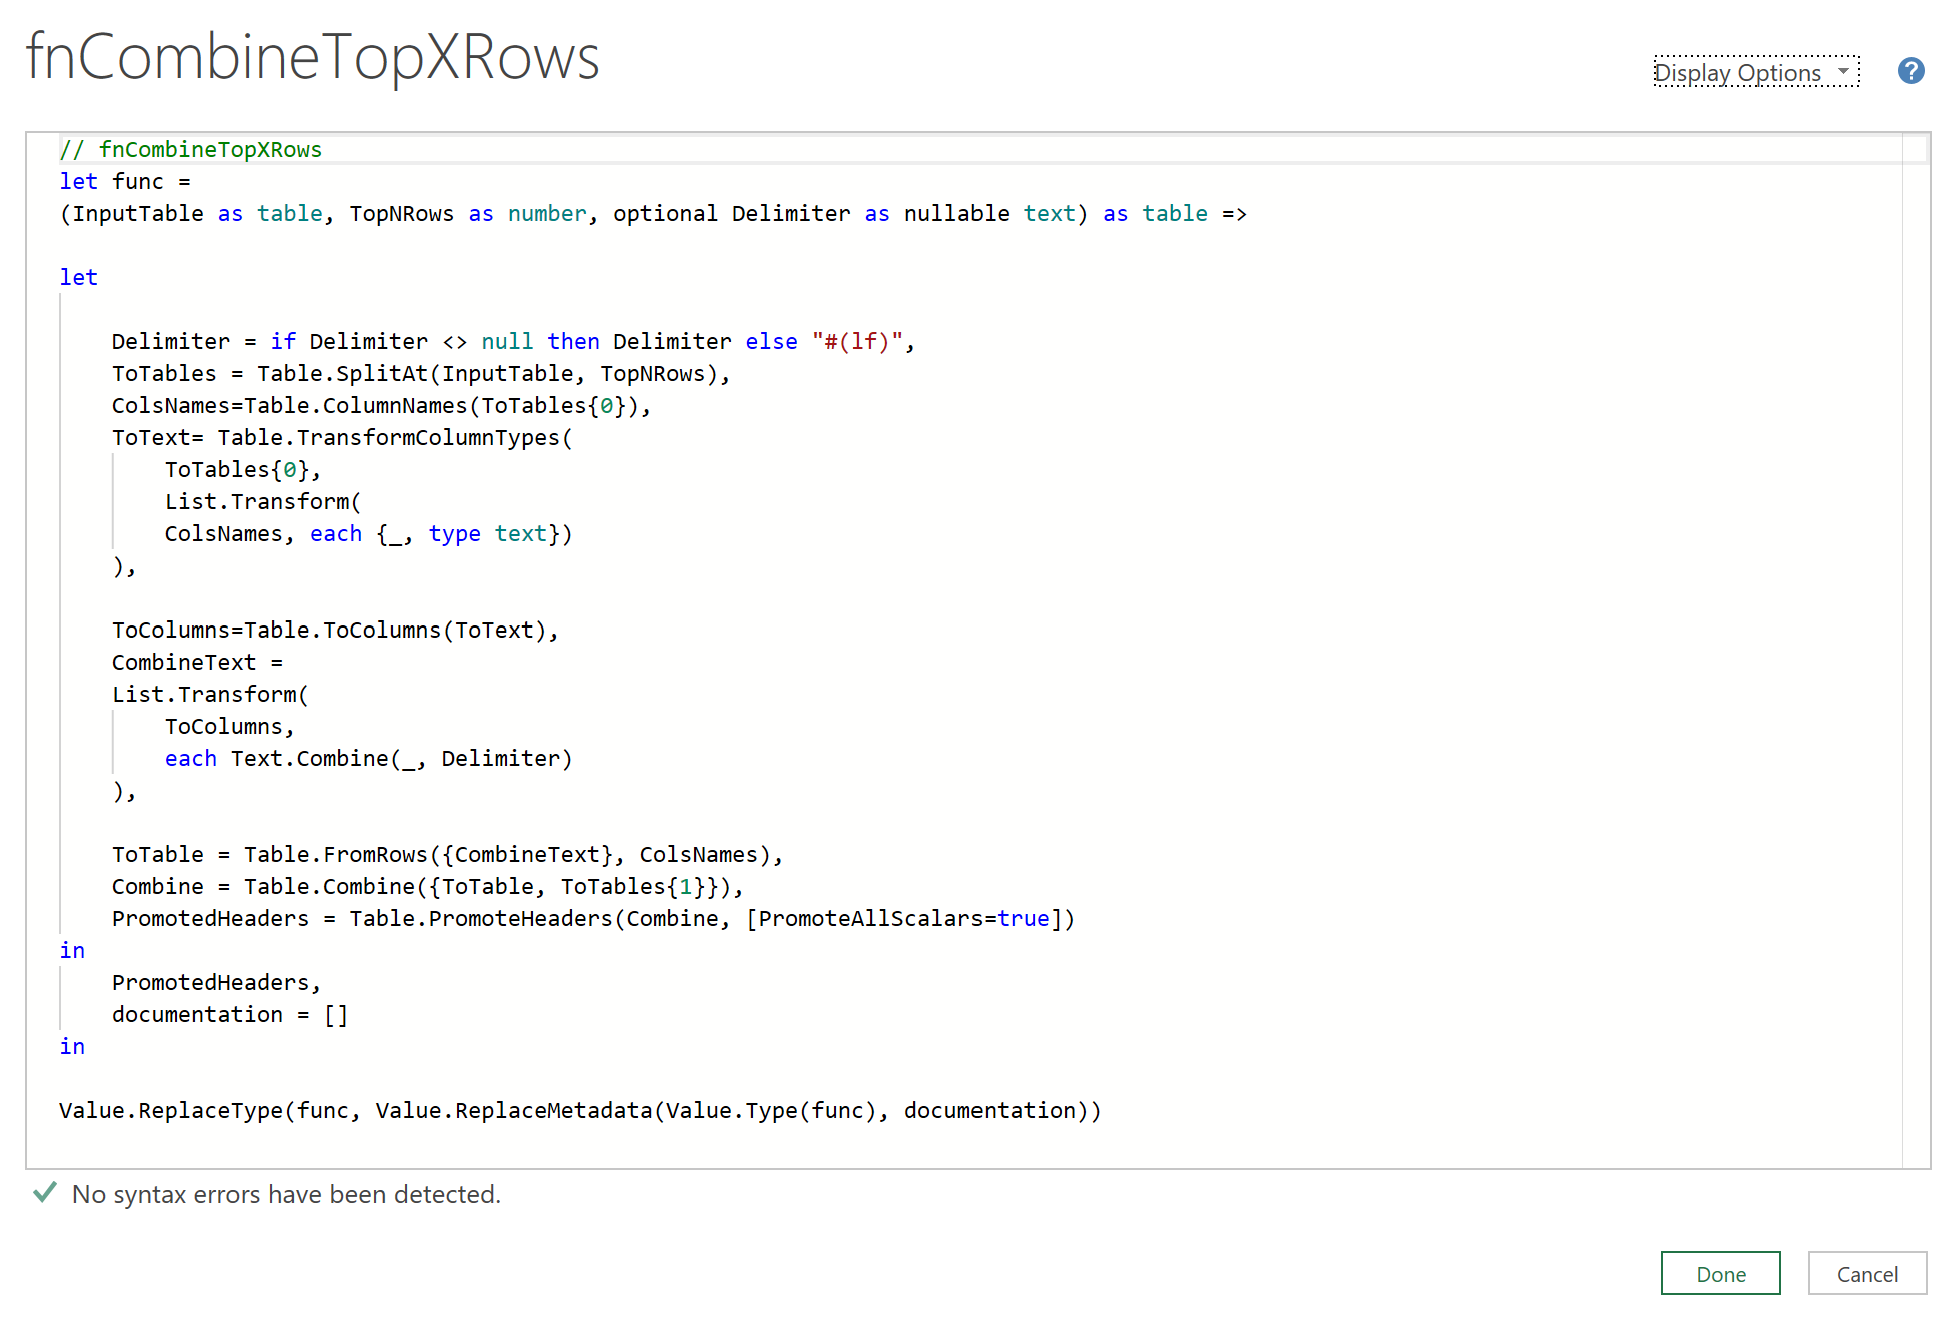
2. Create function to combine top X rows
Next create a function that combines the top x number of rows
- For example, in this case, the below function has been created:
Click to view large-sized image
The function takes in 3 arguments:
- The name of the input table to work on
- The number of rows, starting from the top, that need to be combined in the input table
- The delimiter you wish to you use when combining the data
This function uses several built-in core functions of Power Query - the key ones being List.Transform and Table.Combine
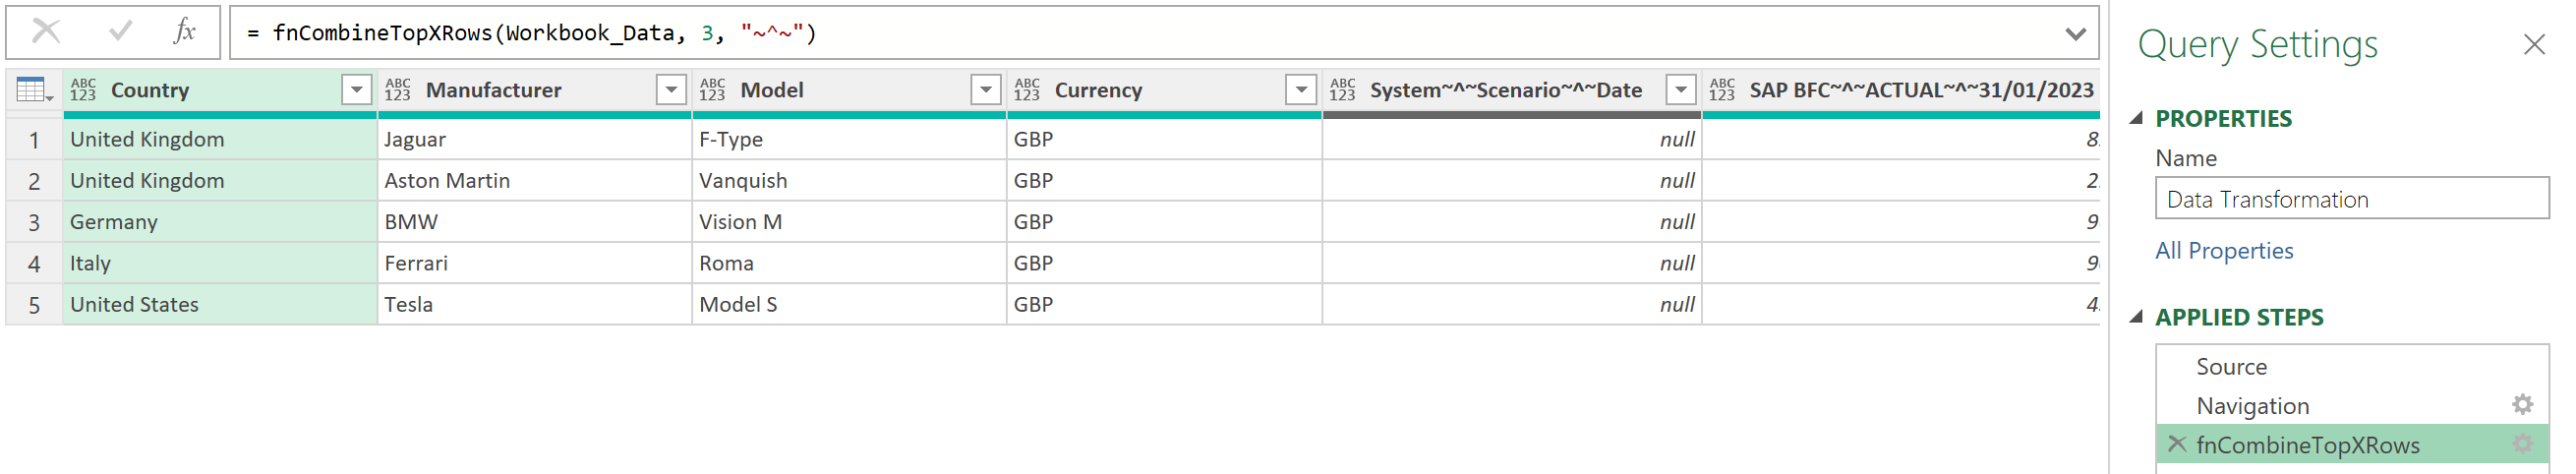
3. Call the function
- Next, call the function as the next step in the main query.
- Once called, you should see the stacked header names combined into a single column heading, and then their values combined in the column headings of the following columns, all separated by a delimited (the one that wsa specified earlier when calling the function)
Click to view large-sized image
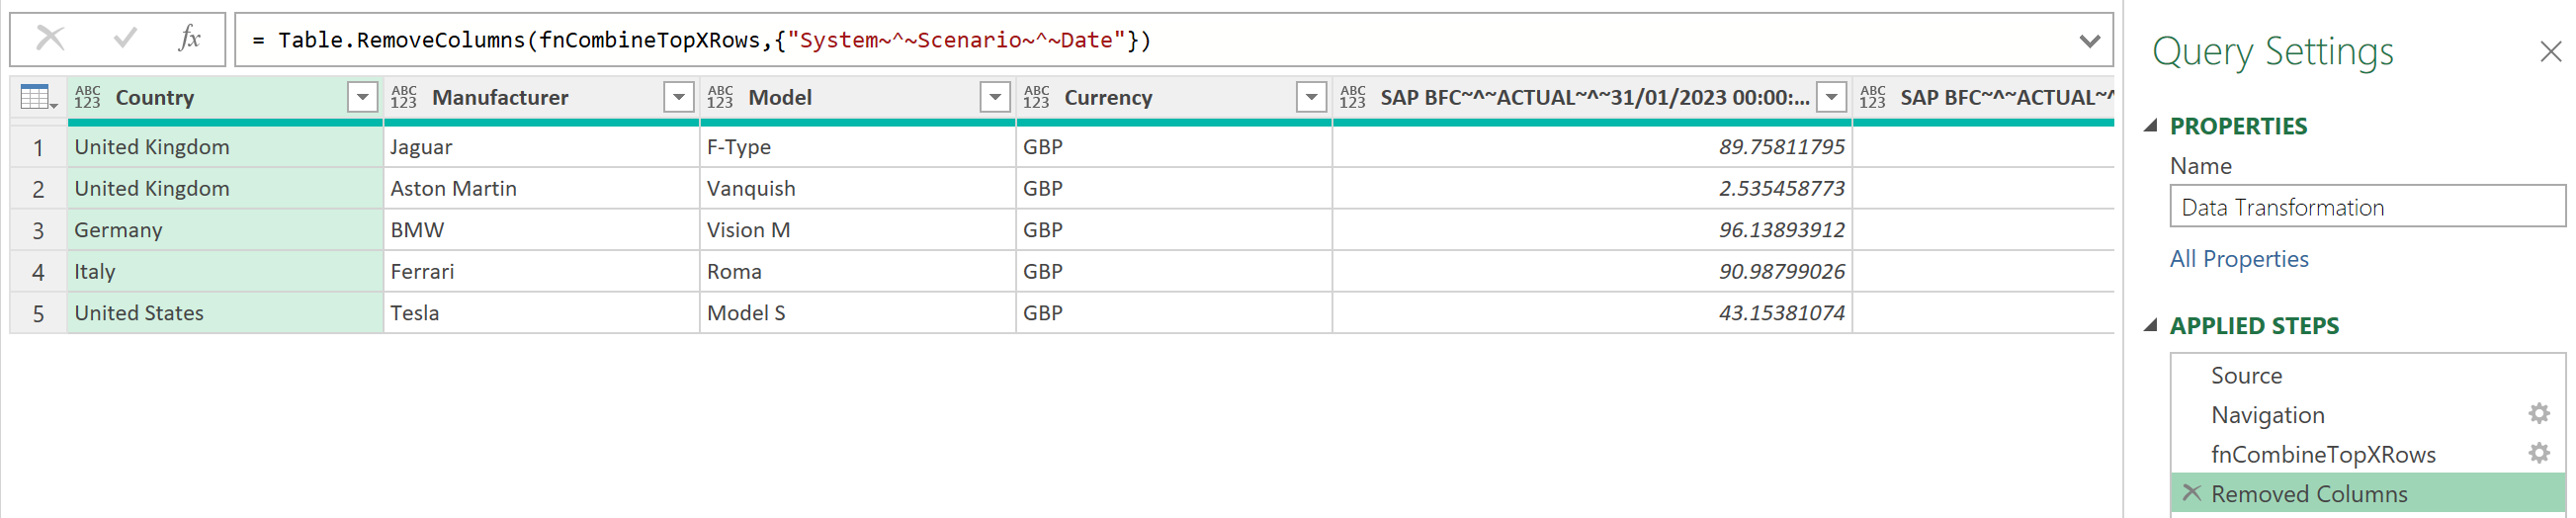
4. Remove uncessary columns
- Next, remove the column that has the “stacked” header names in it. After this, the table should look as follows:
Click to view large-sized image
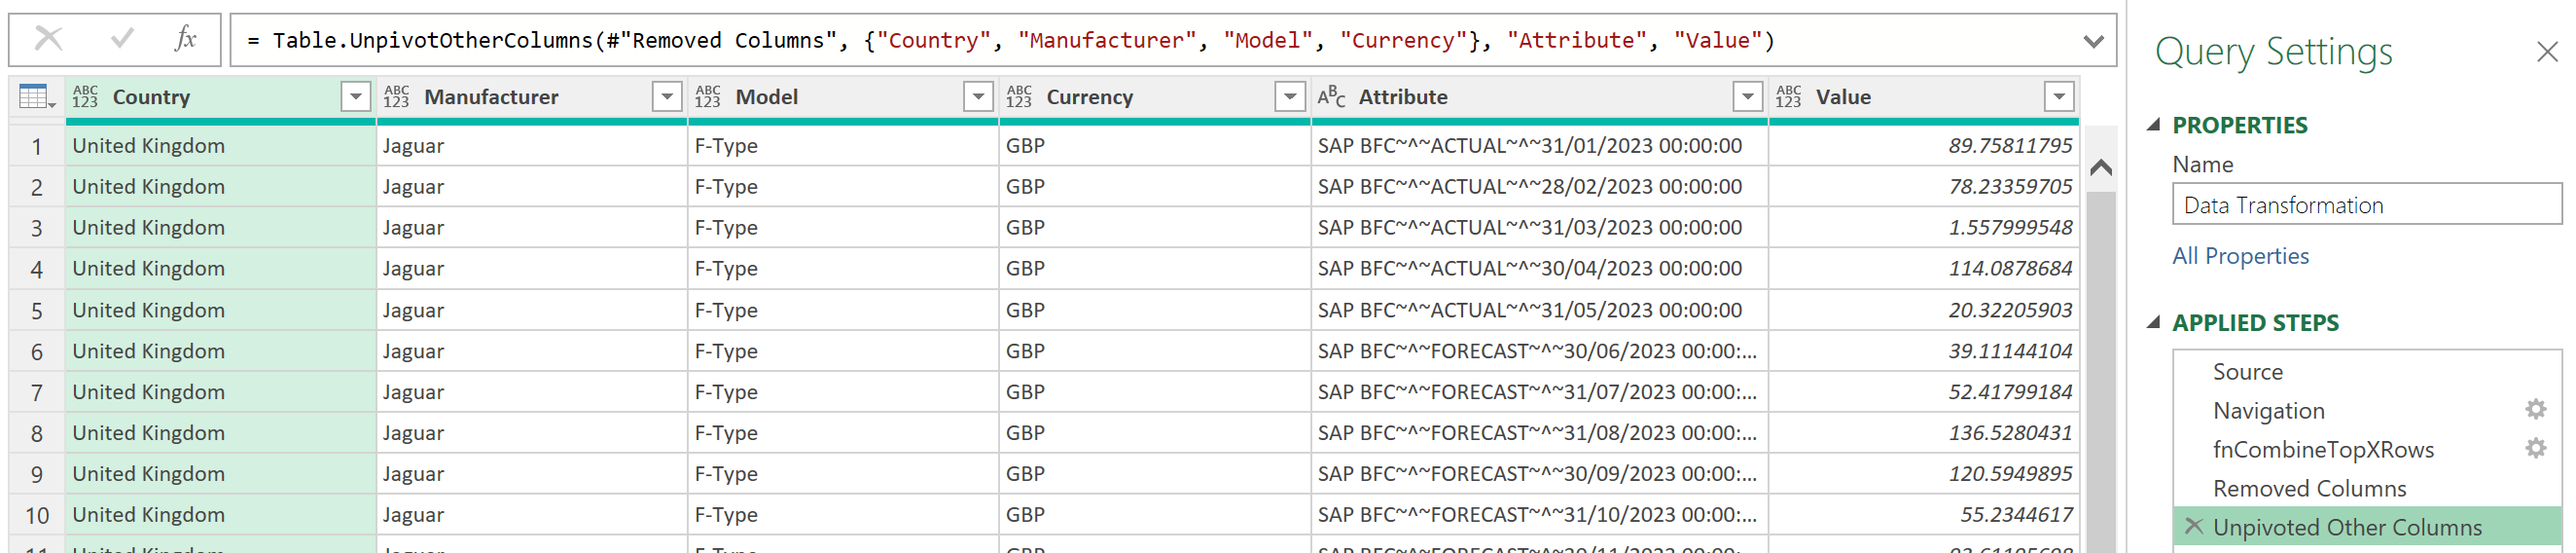
5. Unpivot the dataset
- Now, unpivot all the columns in the table, apart from those containing the original unstacked attributes. After unpivoting the table, the data should now look like this:
Click to view large-sized image
Warning:
There may be an upper limit to the column name fields in Power Query.
This may be upto 1020 characters. So please check that the Query works fully for you first.
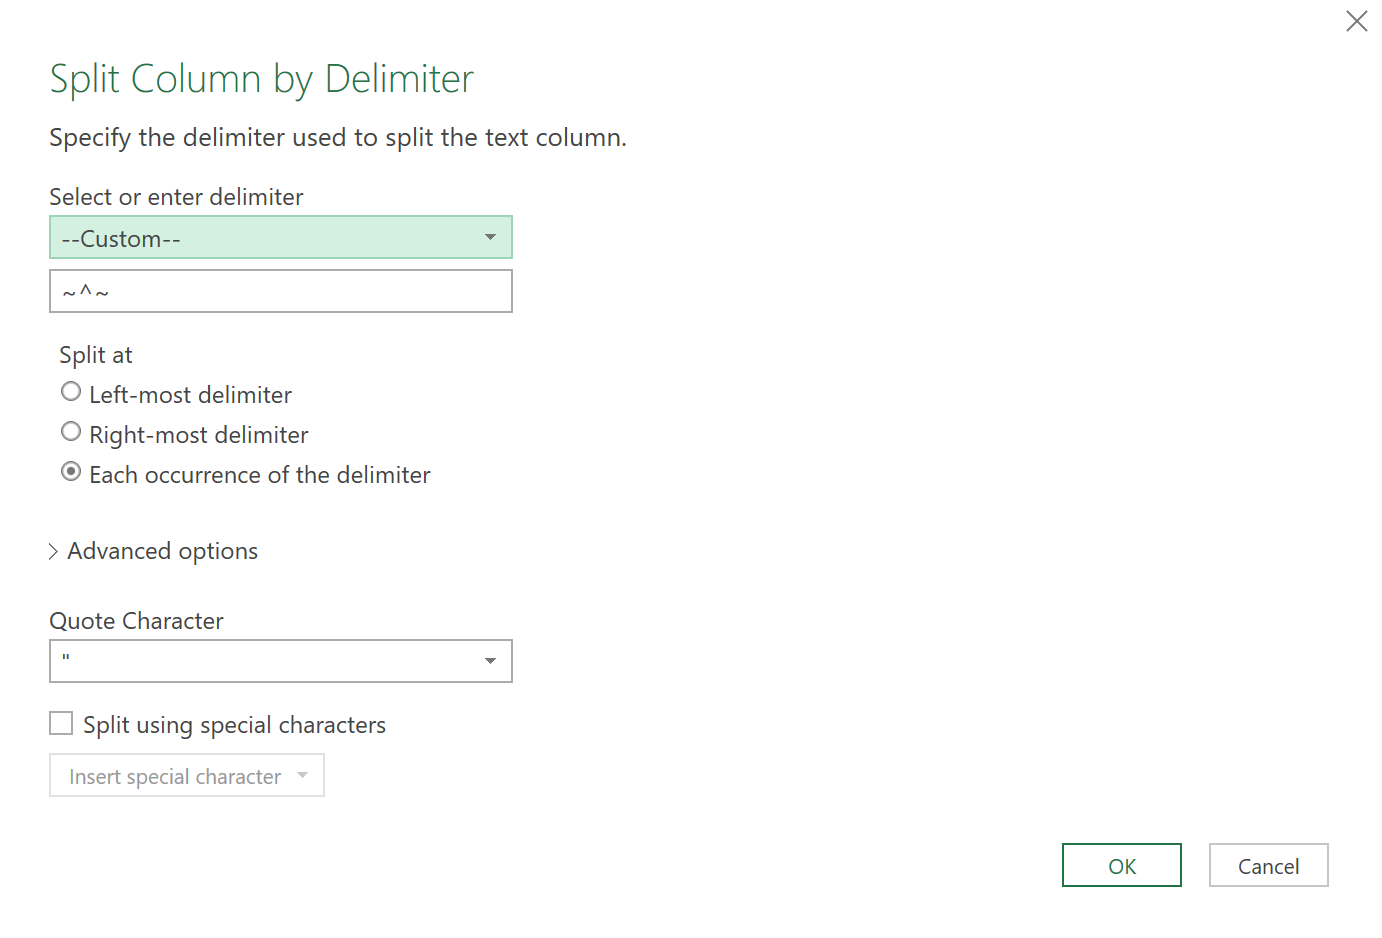
6. Split the Attributes Column - settings
- Now, add a step to split the attribute column using the delimiter that was specified earlier, like shown below:
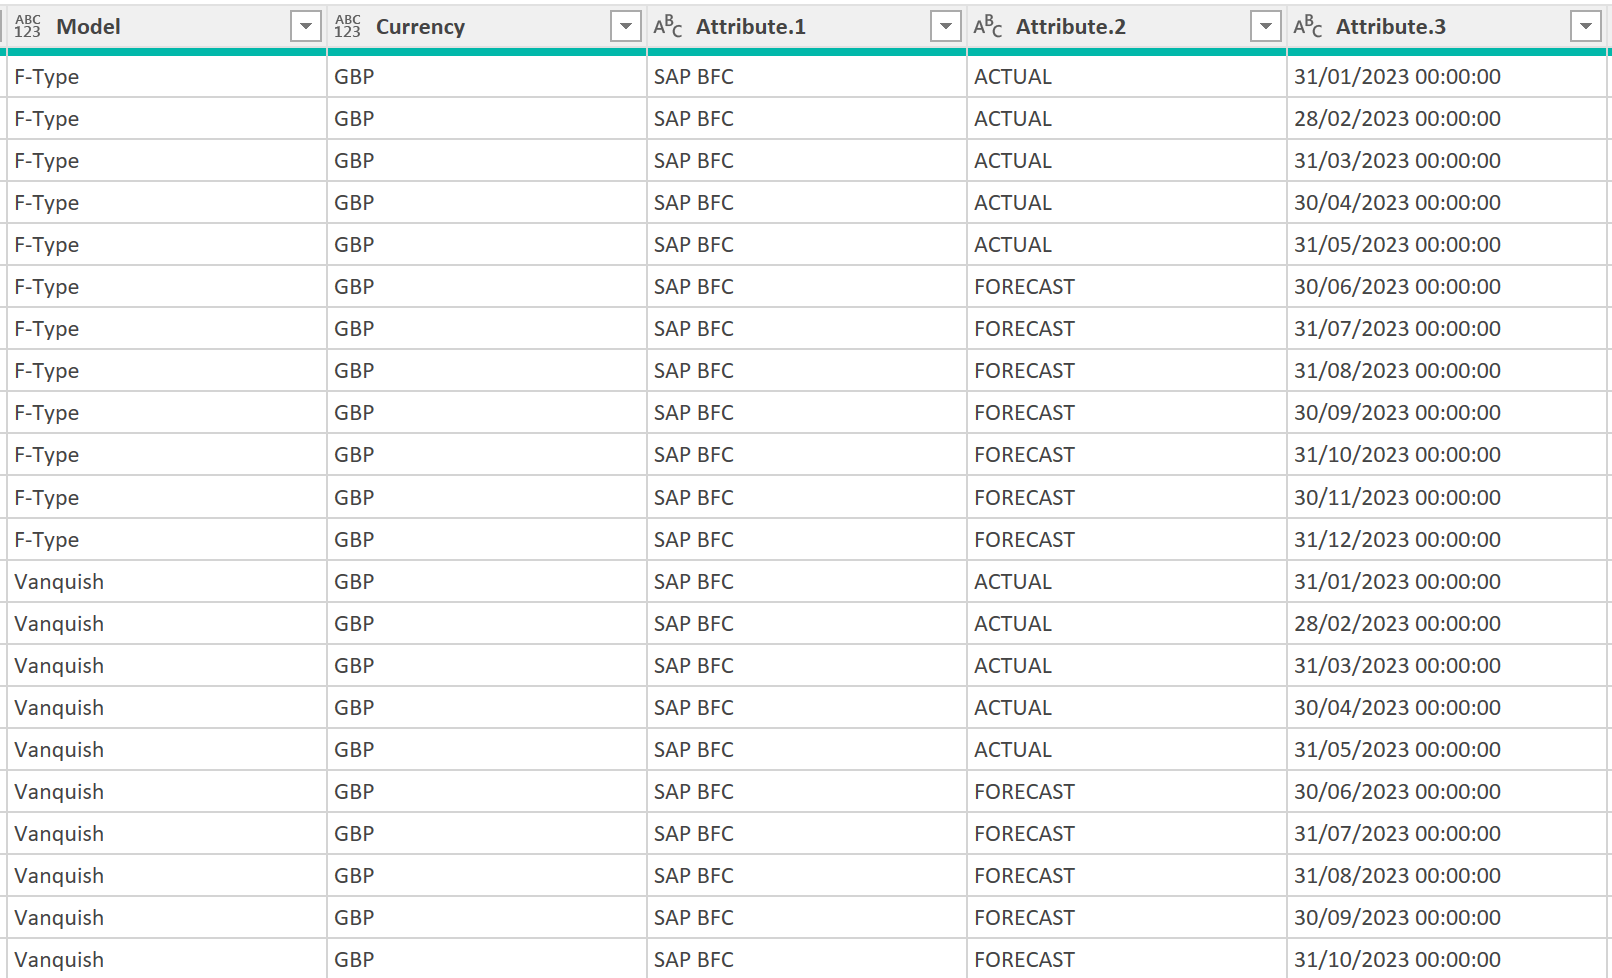
7. Split the Attribute column - result
- Once split, the data should show he values of the stacked attributes in 3 separate columns:
8. Rename the Attribute columns
- Now, rename the attribute columns so they contain the names of the stacked attributes. The data should then look like this:
9. Final M-Code
- The final M-code should look something like this:
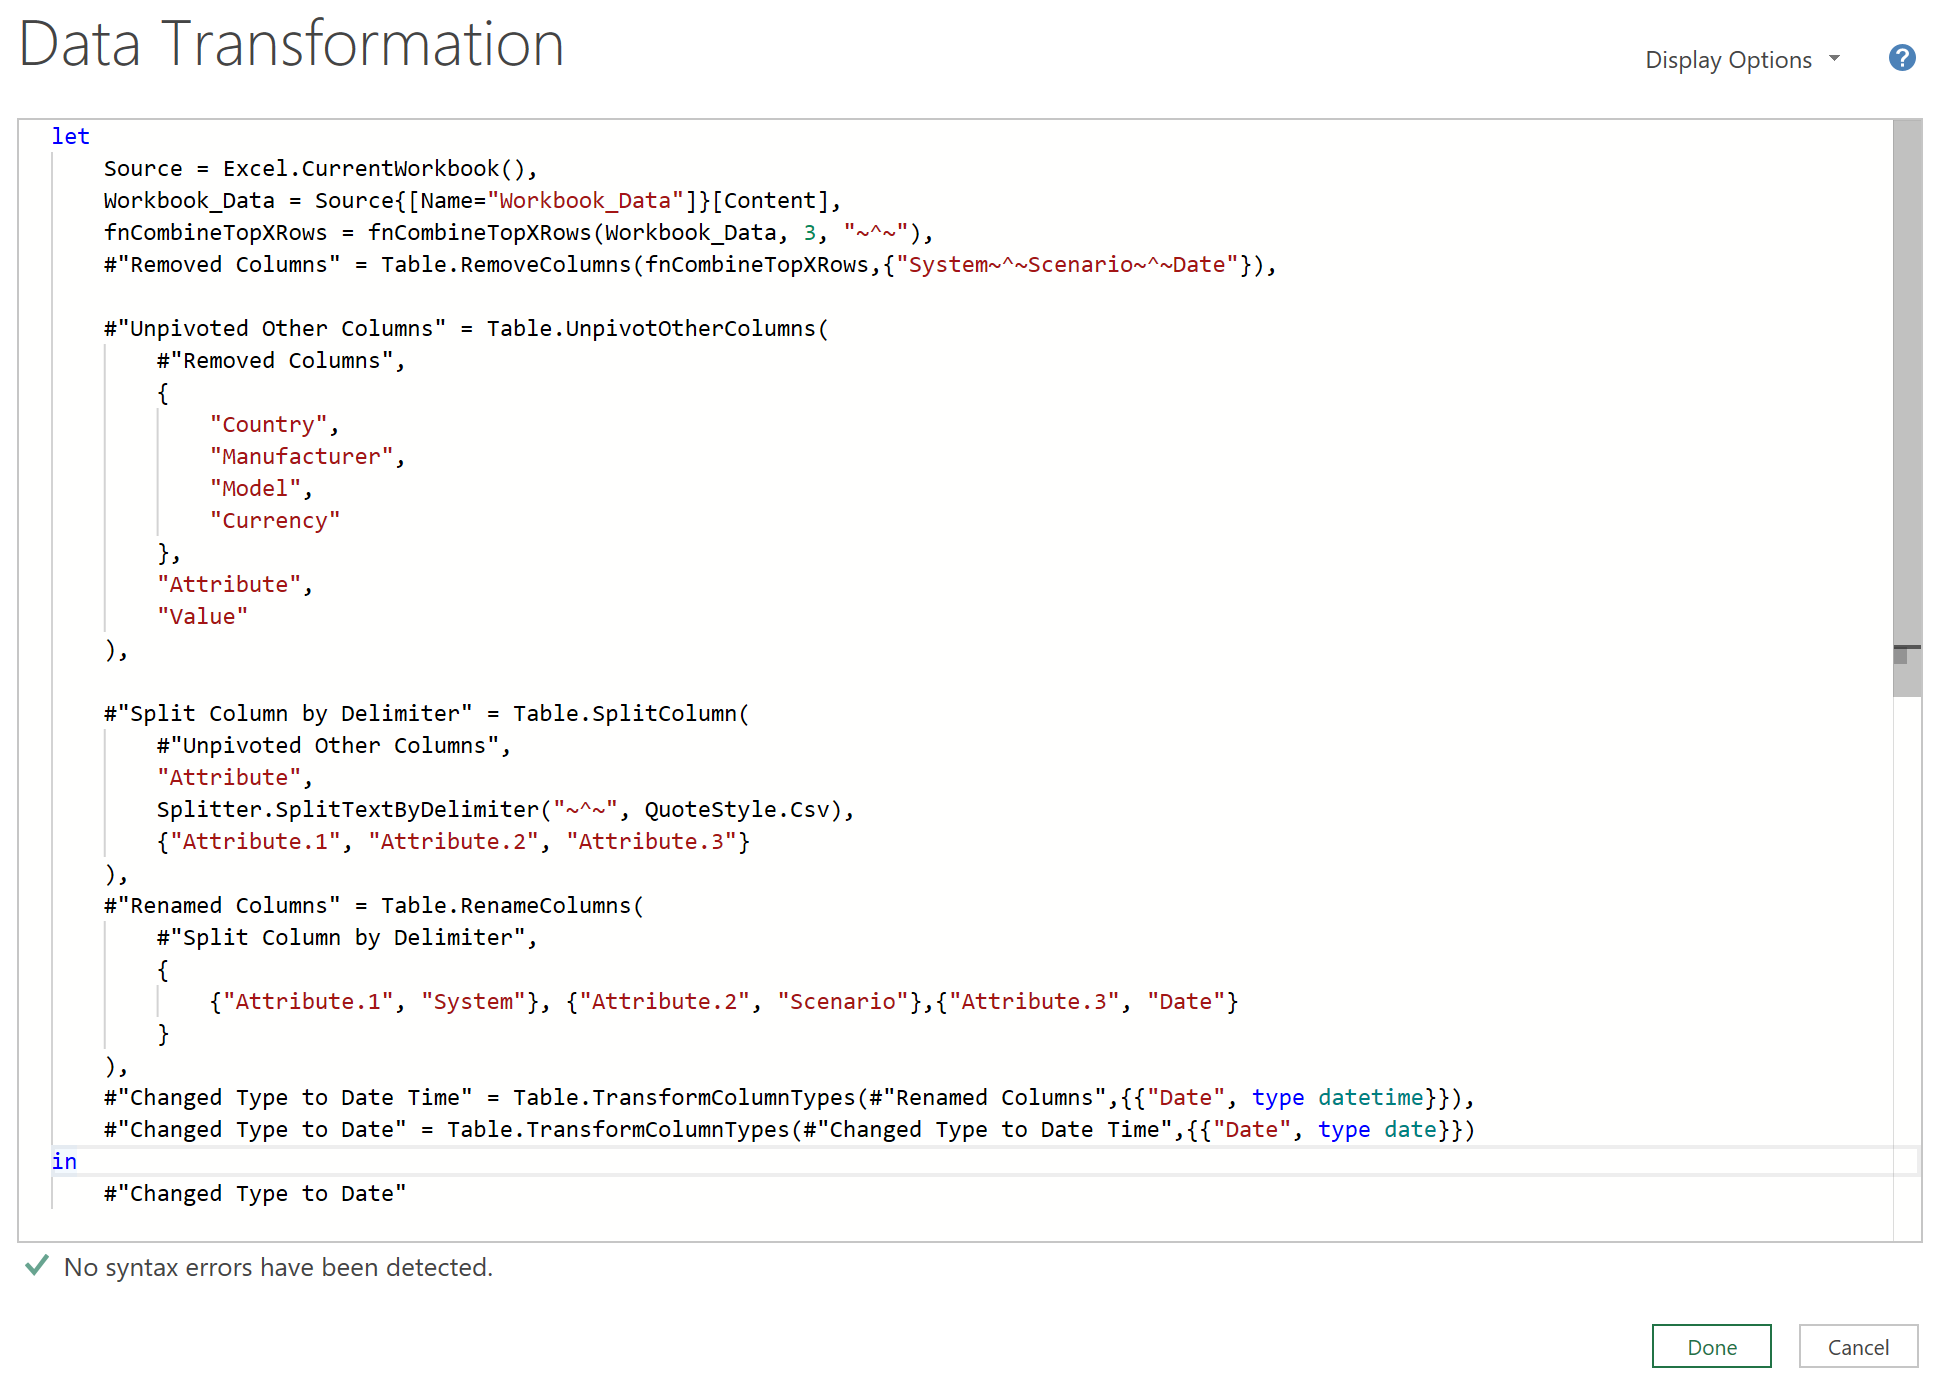
Click to view large-sized image
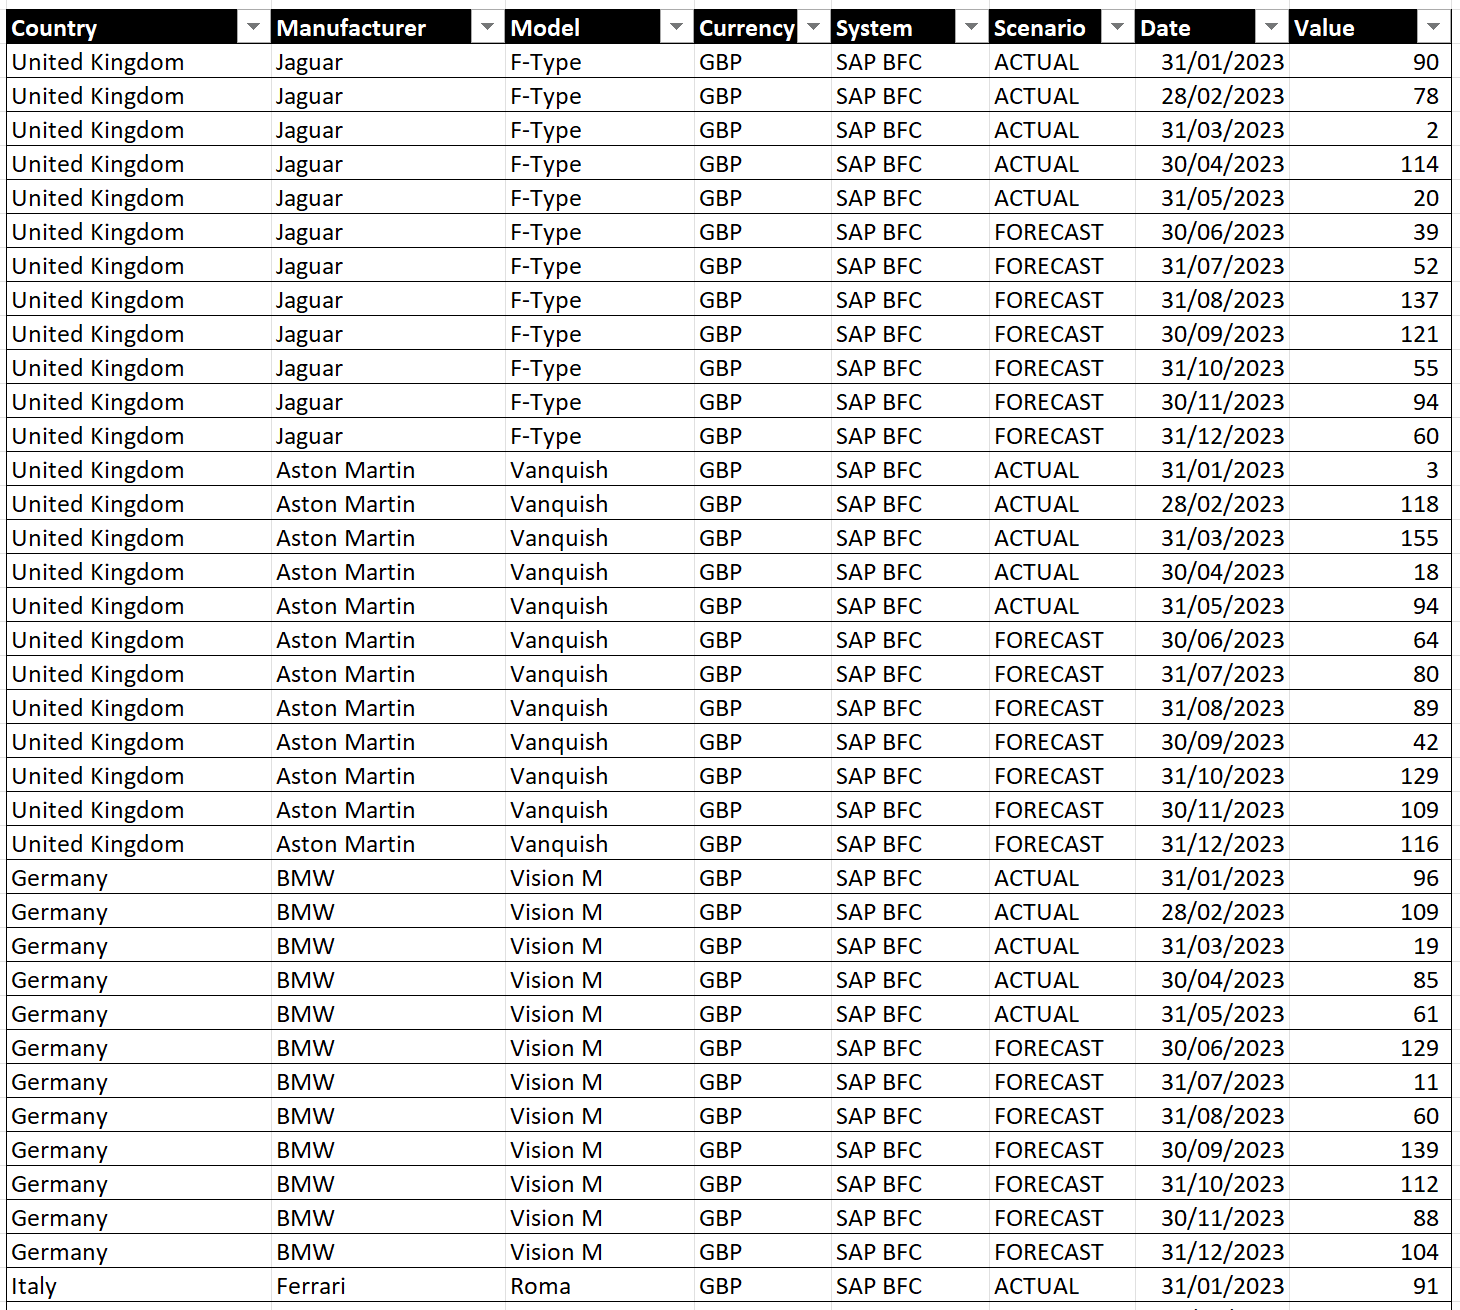
10. Load the data into workbook
- When you load the data into the workbook, you should now see all headers shown side by side, with the values shown in unpivoted form next to them:
See also
- Finance - Financial Planning: Note that the following example achieves a similar result, but was done some time ago (since writing this article), and, as an older approach, requires several more steps and queries. » Read more
Feedback
Submit and view feedback