
Finance - Client Profitability
Overview
In this article, we show how Client Profitability from various company data can be calculated and presented.
Data Inputs
We have the following data:
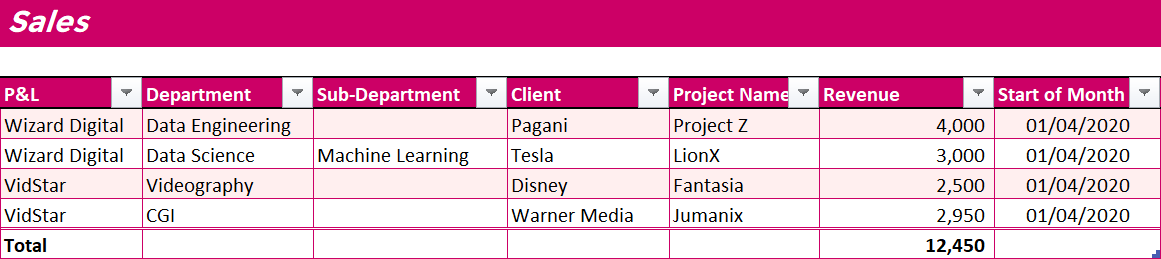
Sales
Revenue is recorded at a project level, for each project. We assume here that we have accurate granular data, and that there are no ‘split projects’, where revenue from the one project has been split across 2 or more lines. The project name should be unique to each line!
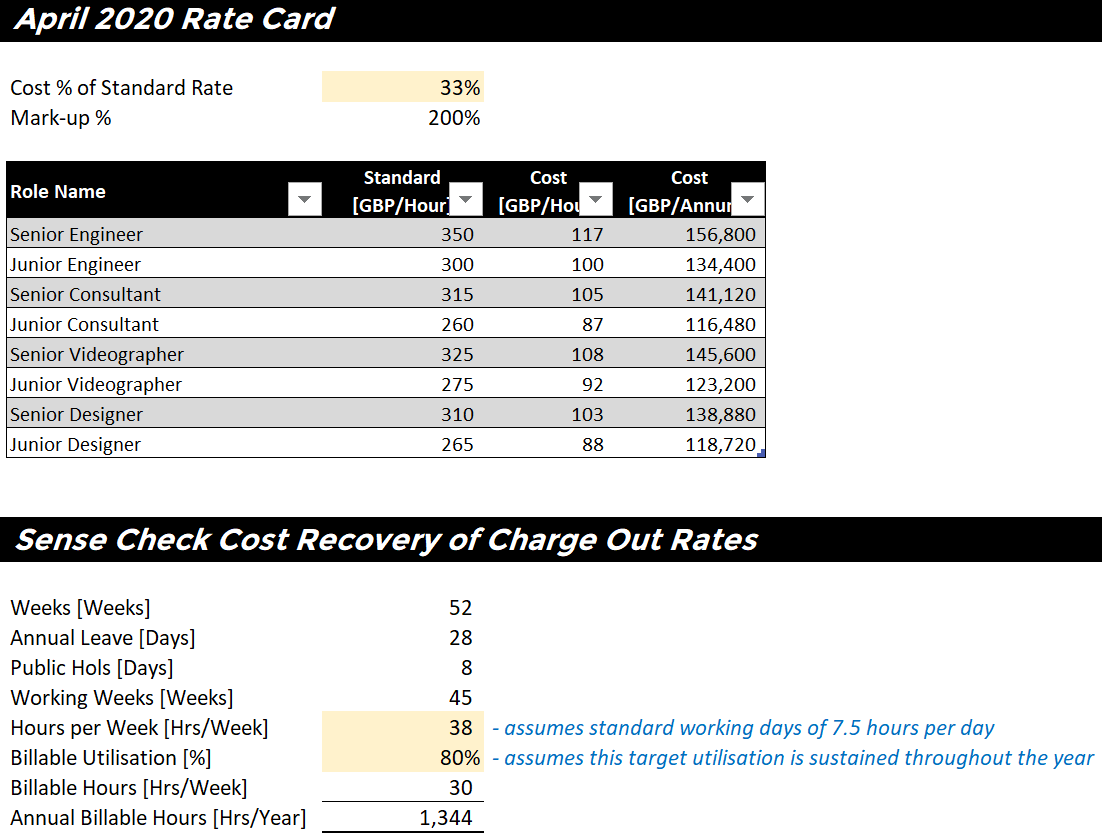
Rate Card
Charge out rates have been set for each job grade level, with costs set at a 1/3rd of the total rate, to help recover for employee costs. A 200% mark-up over staff costs may seem high but is standard for many industries. The mark-up also helps recover for other costs not yet considered, which maybe high (e.g. rent, utilities, insurance, other fixed costs, etc.). Expenses incurred that are re-charged back to the Customer/Client should make no difference!
Timesheets
If you have a good timesheet system, this can be extracted for every project – like shown below:
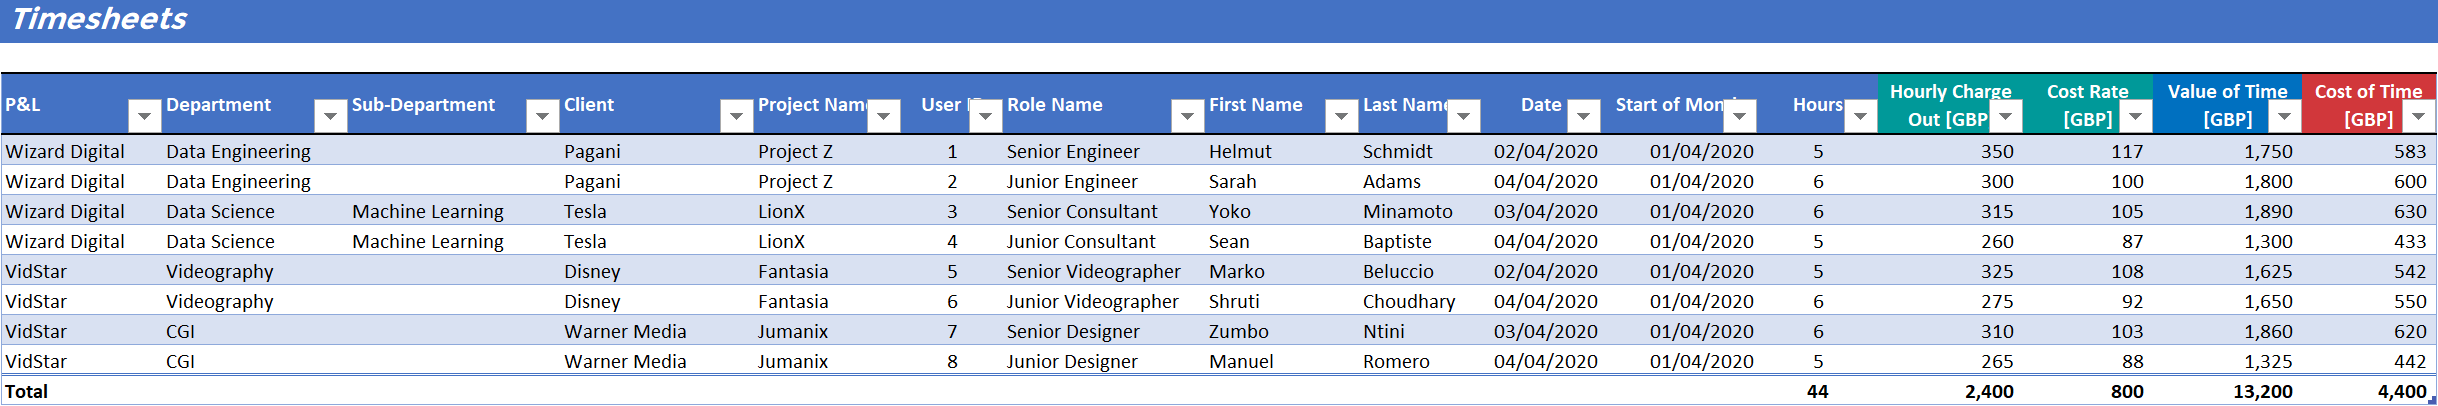
Click to view large-sized image
The coloured columns on the far right take the rates from the rate card data shown earlier. The ‘value of time’ and ‘cost of time’ columns just multiply these by the number of hours.
Note:
You may wish to also exclude hours that don’t directly relate to revenue generating project, such as hours booked by Admin staff, or hours booked by staff that relate to New Business hours – but we have not done that here.
Steps
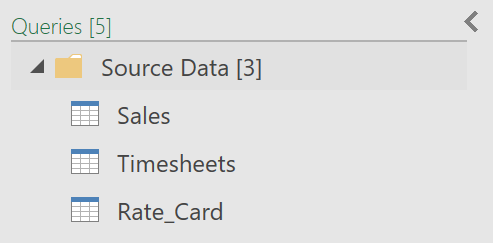
1. Load Datasets
In terms of the setting things up, the first thing to do is load the three datasets above into the ETL editor, so the datasets can be combined easily later.
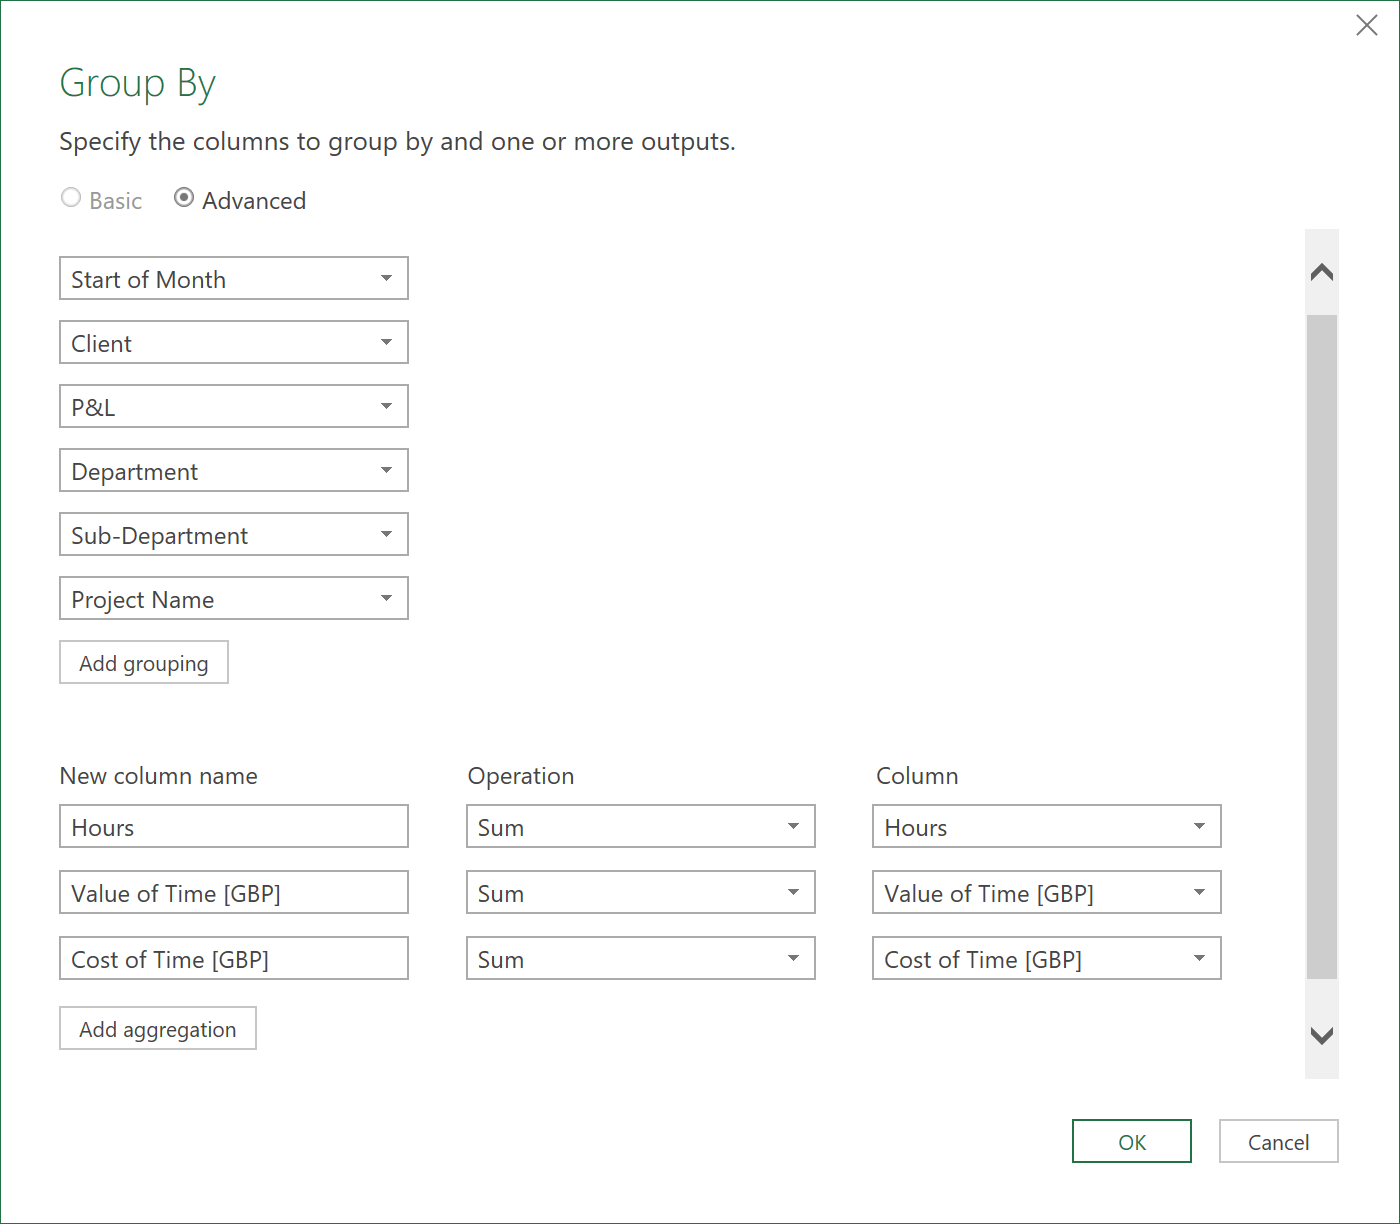
2. Group Timesheet Data
Next, as the timesheet data is shown by individual, we need to group the hours by project instead, to match the level at which revenue is recorded – which is by project, and not individual.
- Create a reference to the “Timesheets” query shown above
- Call the query: “Timesheets Grouped by Project”
- Group the data as follows:
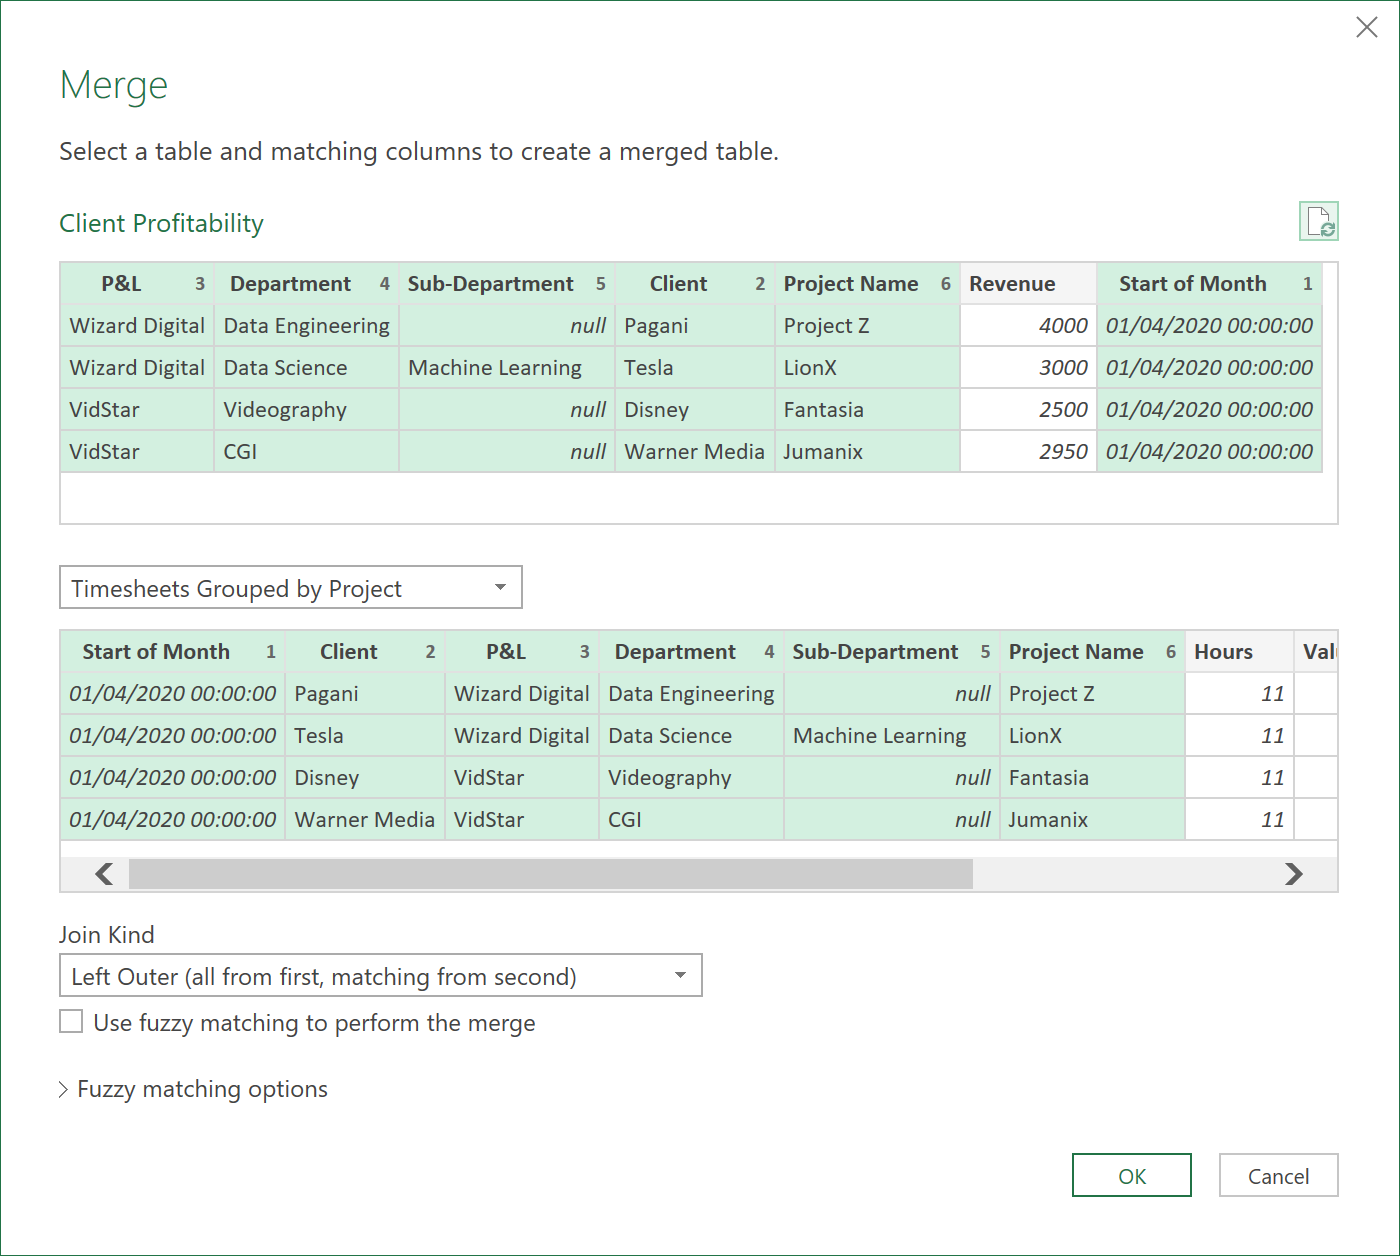
3. Client Profitability
- Next, create a query that references to the “Sales” query created earlier.
- Call the query: “Client Profitability”.
- Apply the following Merge operation with the “Timesheets Grouped by Project” query created above:
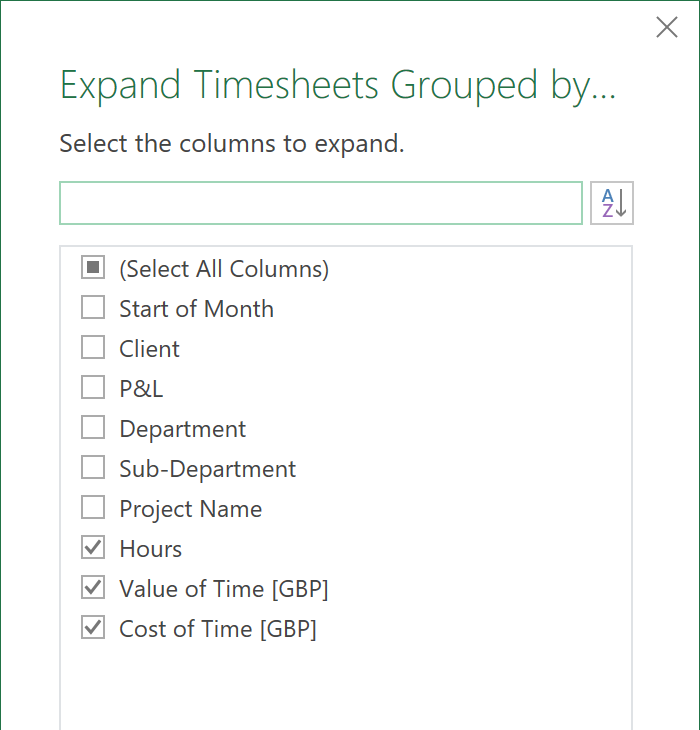
- After the merge, extract the following fields
- Reorder the columns so the ‘Start of Month’ column as at the front
- Apply data types to all columns
When you load the query back into excel it should now look like this:
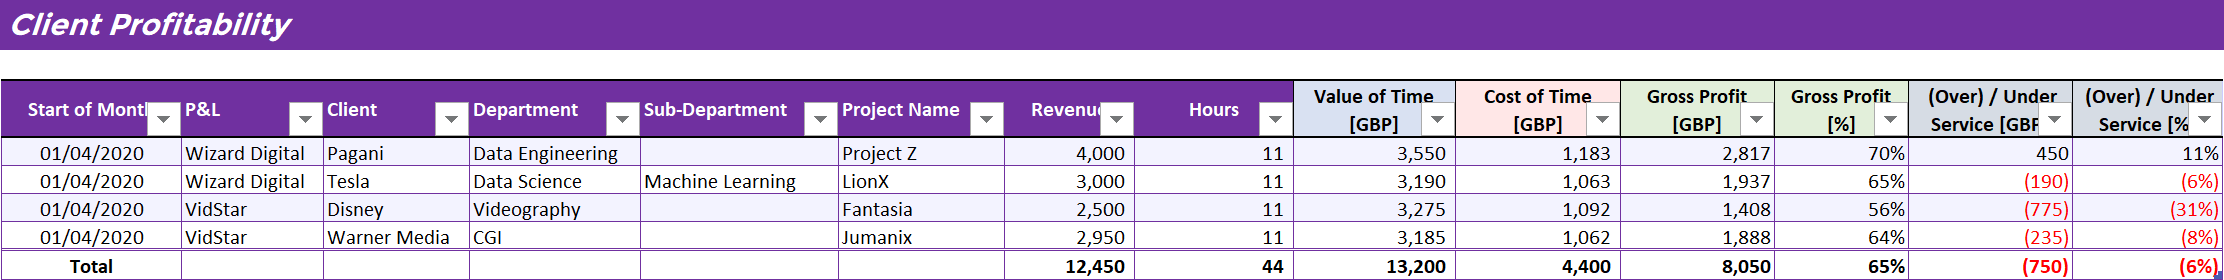
Click to view large-sized image
The ‘Gross Profit’ and ‘Under / Over Servicing’ columns have been added as calculated columns in Excel itself.
Now you have a way of easily tracking Client Profitability!
4. Create a Checks Sheet
It is helpful to also create a “Main Checks” sheet, in case, for example, time has been booked to projects where no revenue has been recorded. An illustrative Check Sheet is shown below:
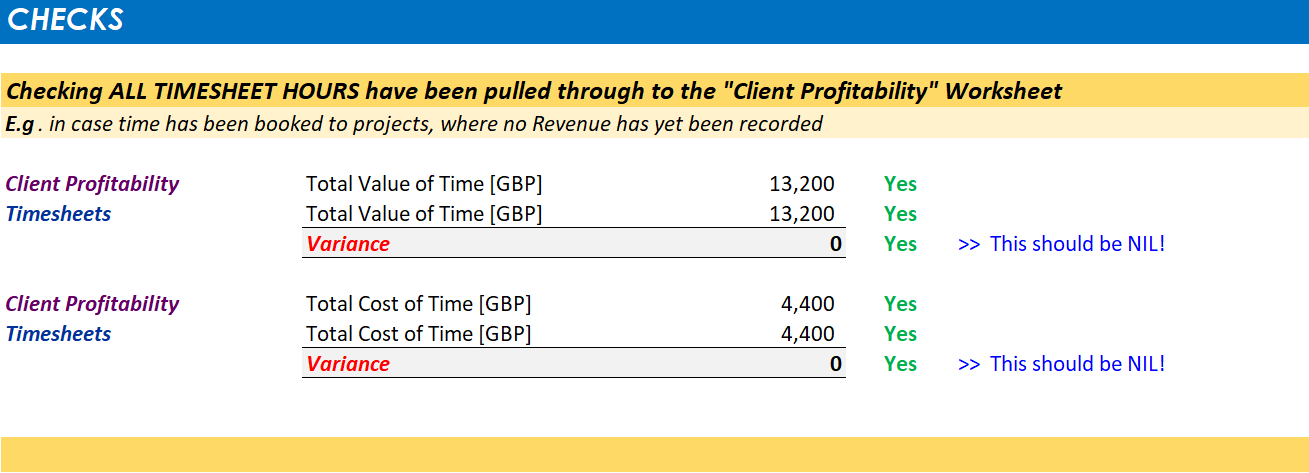
Important:
To also include nil revenue projects, where time has been booked, the “Client Profitability” query would need to be modified with some extra steps, but, for now, we have not done that - we only show projects where there is revenue, where time has been booked.
5. Download Excel File
The full excel file can be downloaded here: Client Profitability - Excel File
Feedback
Submit and view feedback