
Stock price thresholds
How long was a stock price above a given value?
The table below shows stock price of a company at one-minute intervals over the course of an hour.
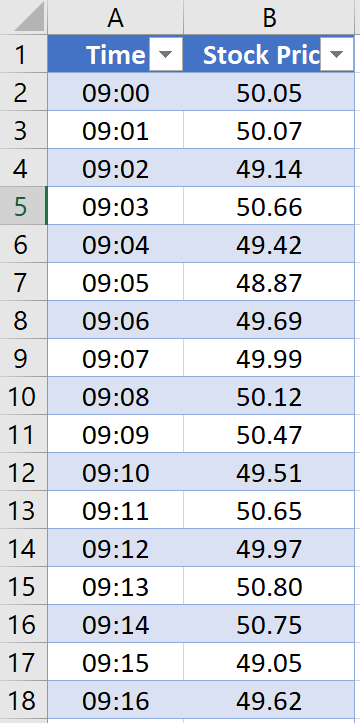
The price hovers around $50.
This article explains how to find the maximum length of time in minutes, that the price was greater than or equal to $50 in this period.
Steps
1. Create a query for the source data
- Click inside the table in the Excel worksheet
- Click the From Table/Range icon on the Data tab in Excel to create a new query. The Query Editor window will open.
- Select the Time column, and in the Data Type drop-down box on the Home tab of the Query Editor toolbar, set the data type for this column to be Time.
- Then select the Stock Price column and set the data type for this column to be Number.
2. Add custom column
- Next, click the Custom Column button to add a new custom column to the table.
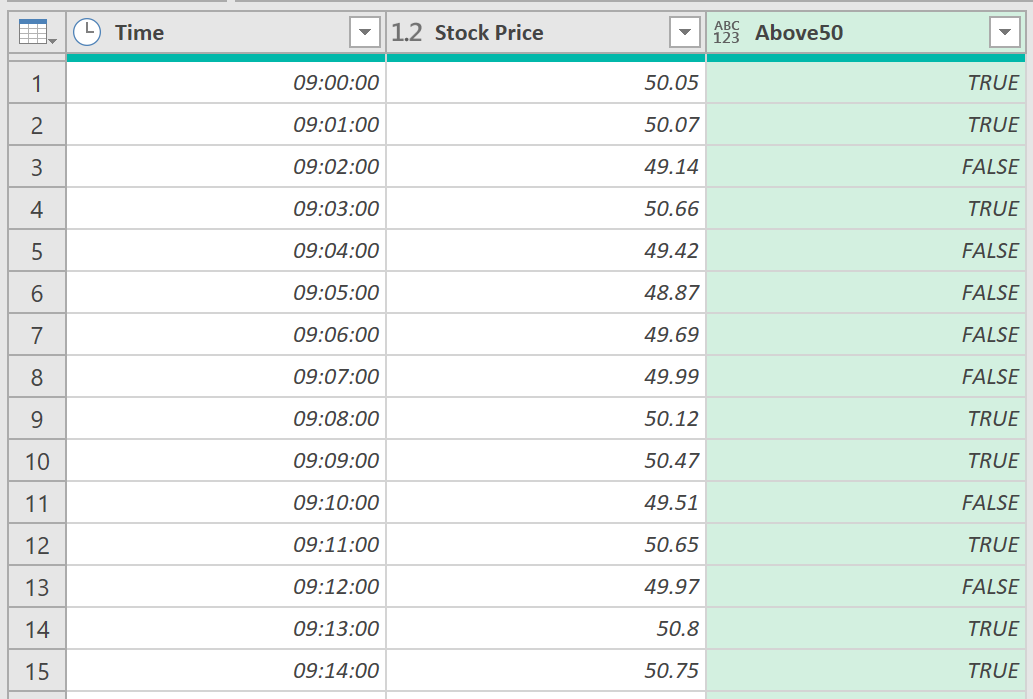
- Call the new column Above50 and use the following expression for it:
[Stock Price]>=50
The output should be as shown below – the new column returns the value TRUE when the stock price is greater than or equal to 50, and FALSE otherwise.
3. Group data
- Select the Above50 column and click the Group By button on the Home tab of the Query Editor toolbar.
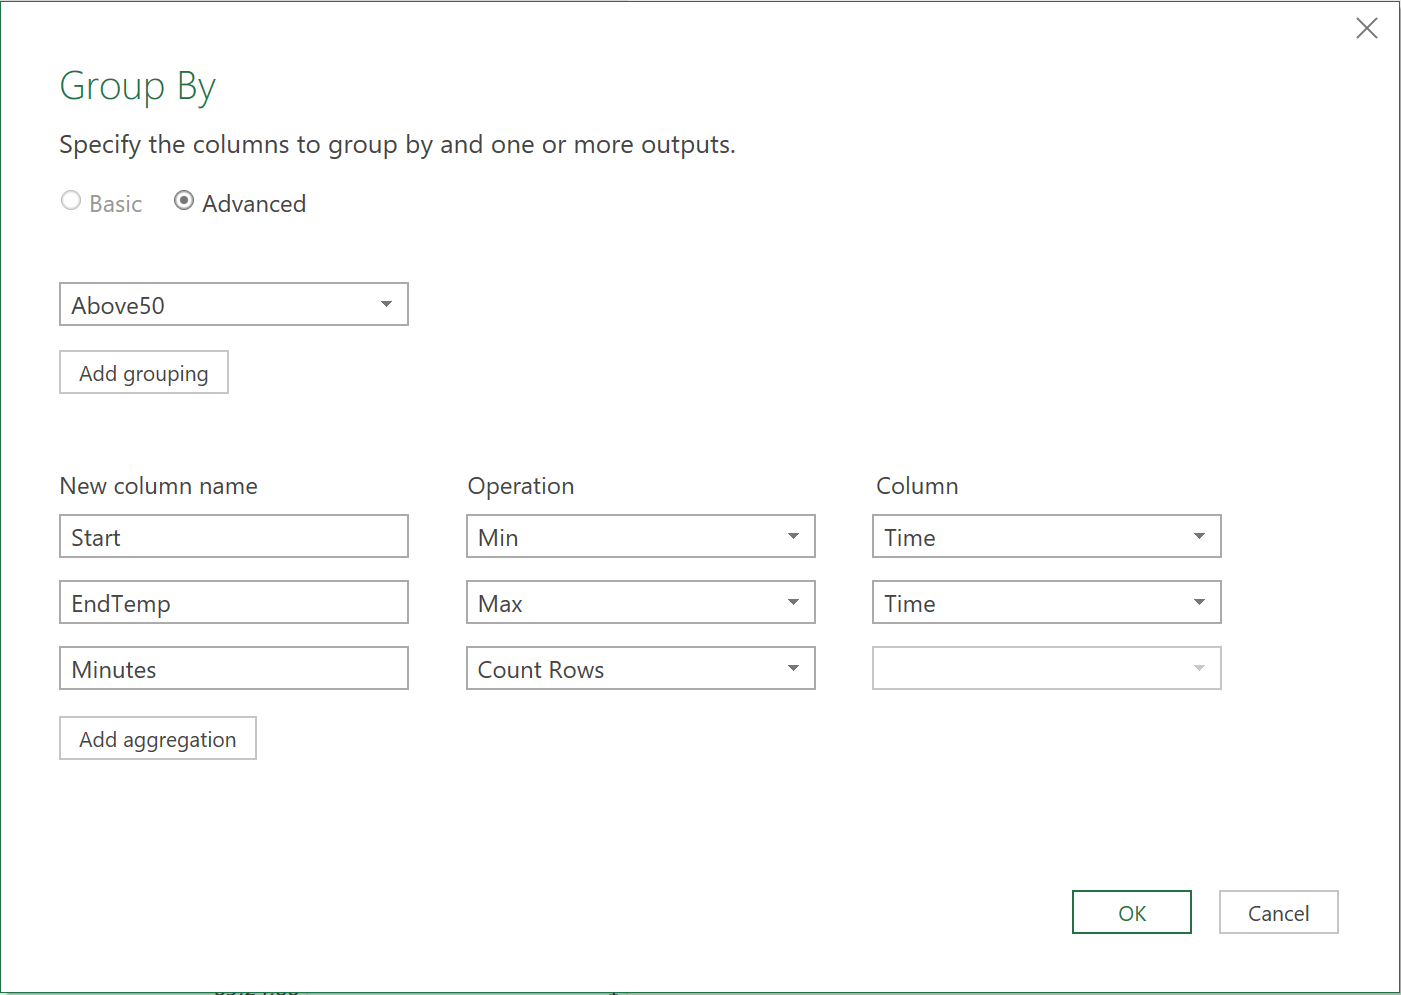
- When the Group By dialog appears, ensure that the Above50 is the only column selected in the Group By drop-down box
- Then create three aggregate columns (you will need to click the + button on the right-hand side of the dialog to add the second and third columns):
- one to find the minimum value of the Time column, called Start;
- one to find the maximum value of the Time column, called EndTemp; and
- one to count the number of rows in the table, called Minutes.
- The dialog should be configured as below:
When you click OK to close the Group By dialog, you will see the table has been aggregated so that there are only two rows in the output:
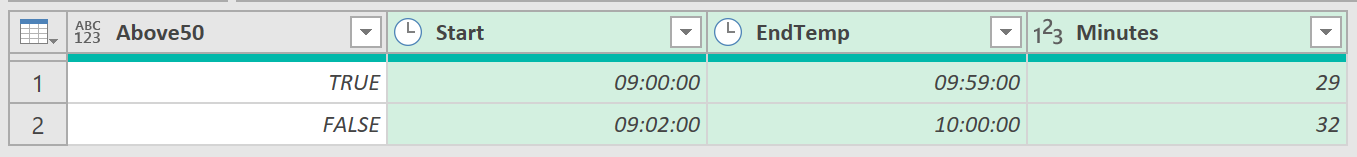
One for the time periods where the stock price was greater than or equal to 50, and one where it was not.
This is not quite what you need, though, as you actually want is to find all of the time ranges where the stock price was greater than or equal to 50. To do this you need to perform a local grouping by adding GroupKind.Local as the fourth parameter of the Table.Group( ) function.
4. Edit ‘M’ code
- To make this change, go to the formula bar and change the code for the current step from this:
Table.Group(
InsertedCustom,
{"Above50"},
{{"Start", each List.Min([Time]), type time},
{"EndTemp", each List.Max([Time]), type time},
{"Minutes", each Table.RowCount(_), type number}})
- to this:
Table.Group(
InsertedCustom,
{"Above50"},
{{"Start", each List.Min([Time]), type time},
{"EndTemp", each List.Max([Time]), type time},
{"Minutes", each Table.RowCount(_), type number}}, GroupKind.Local)
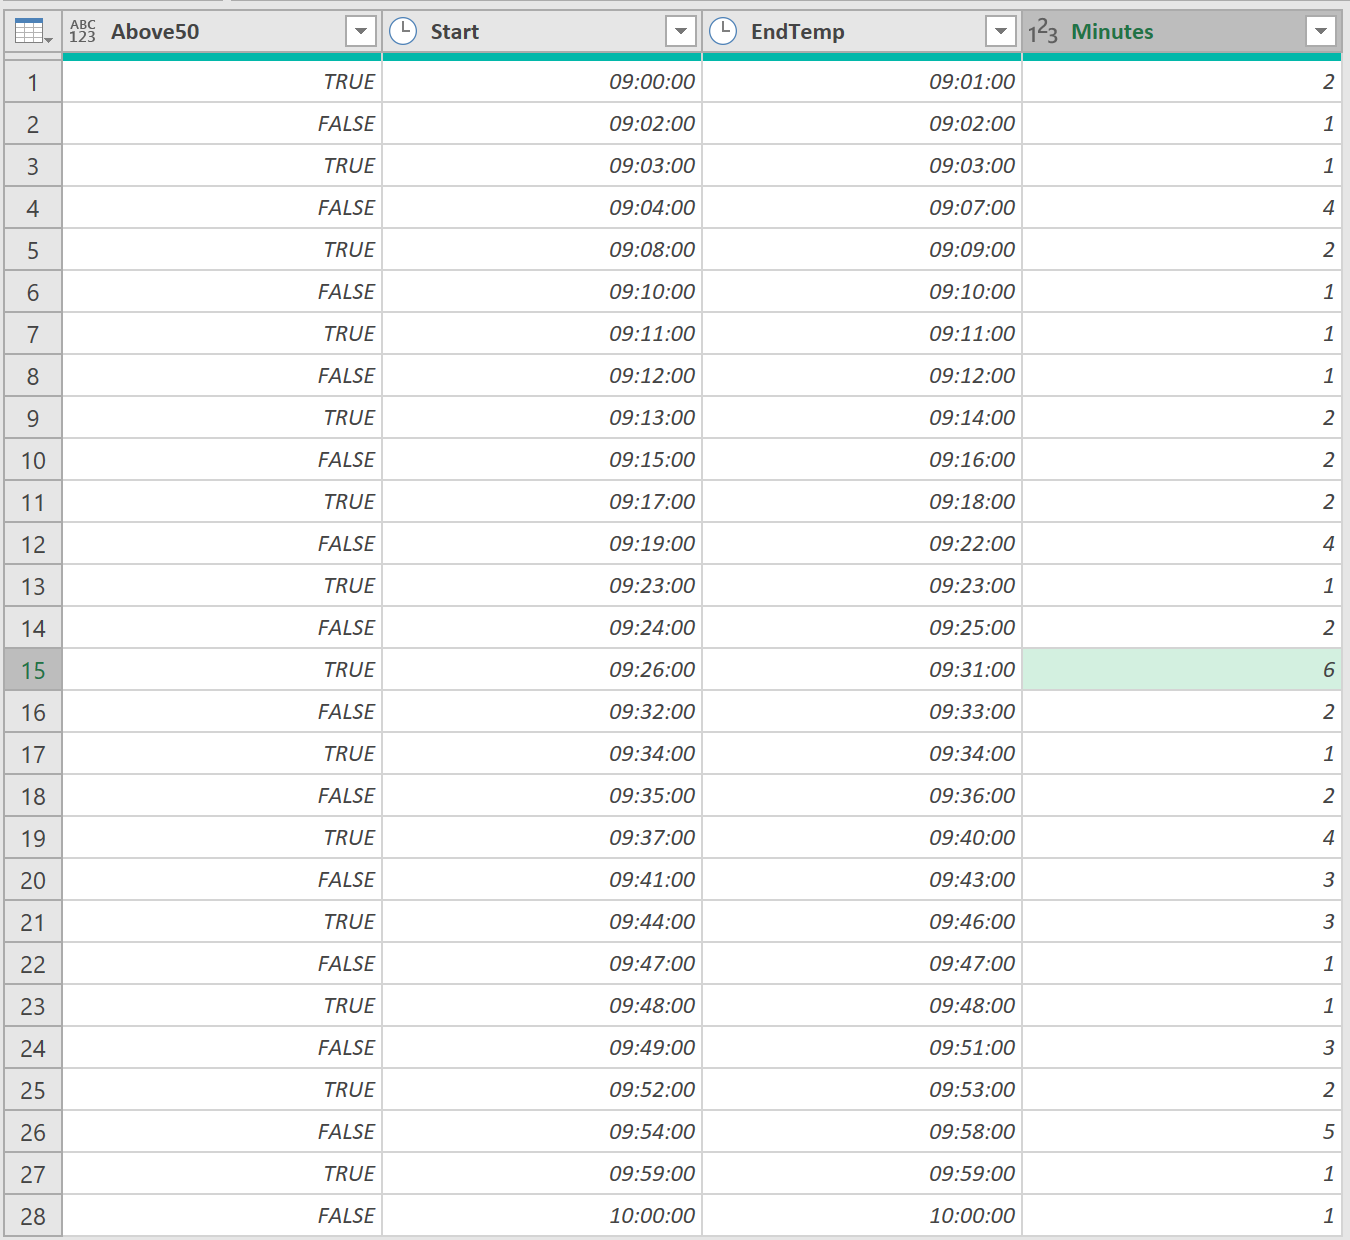
The output should now be as shown below:
5. Modify end time
The times in the EndTemp column are slightly misleading in that they represent the last minute in the time range; to avoid confusion you need to add one minute to these values so that the end of one time range is the same as the beginning of the next one.
- To do this, click the Custom Column button to create a new custom column, call it End, and use the following expression:
= [EndTemp] + #duration(0,0,1,0)
-
Select the EndTemp column, right-click, and select Remove from the right-click menu to remove the EndTemp column from the table.
-
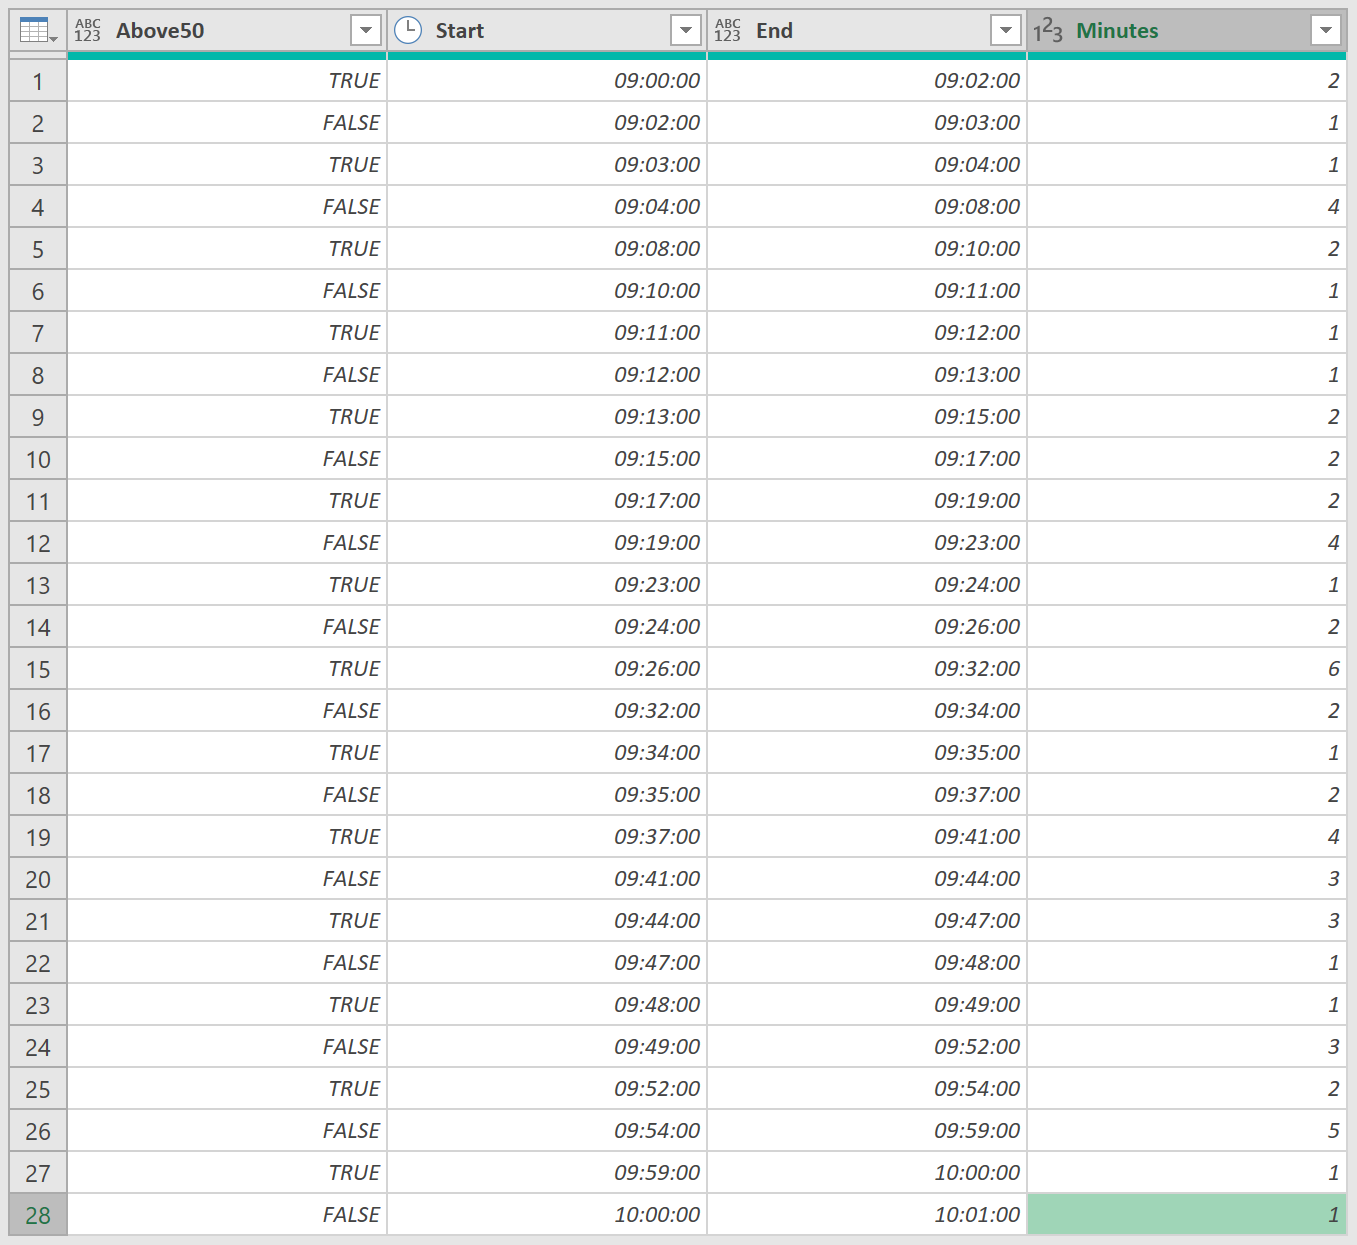
Select the End column in the Query Editor and drag it in between the Start and Minutes column. The output will be as shown below.
6. Filter and sort data
As we are only concerned with the time ranges when the price was greater than or equal to $50, you can now filter the table for only those rows where the Above50 column is TRUE.
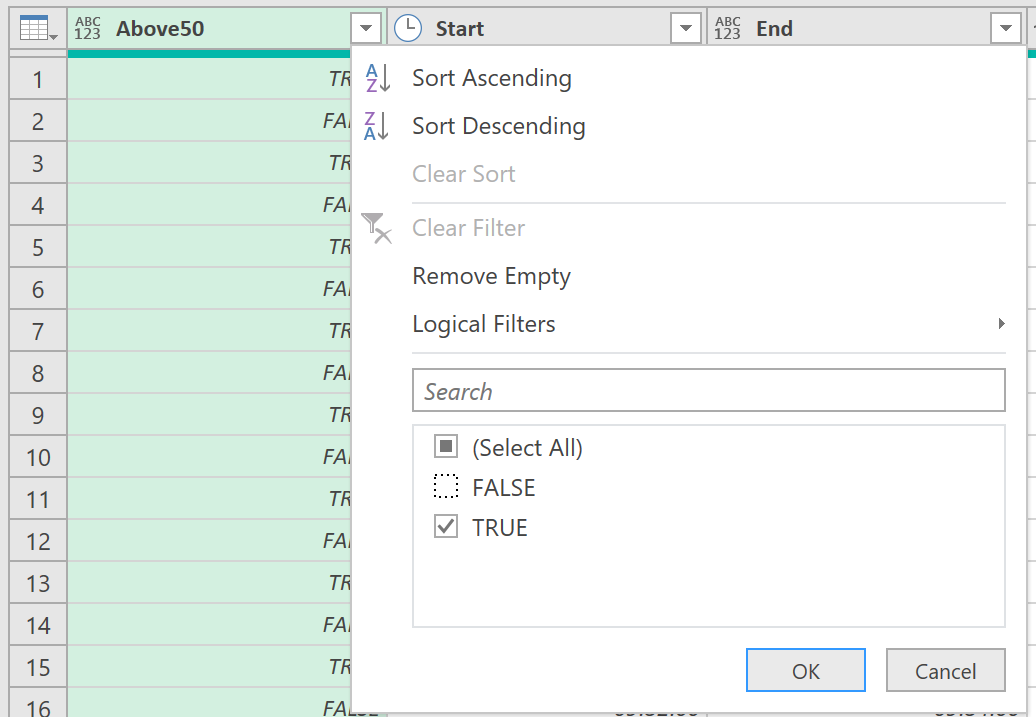
- You can do this by clicking the down arrow button in the column header for the Above50 column and unchecking the FALSE value, then clicking OK, as shown below
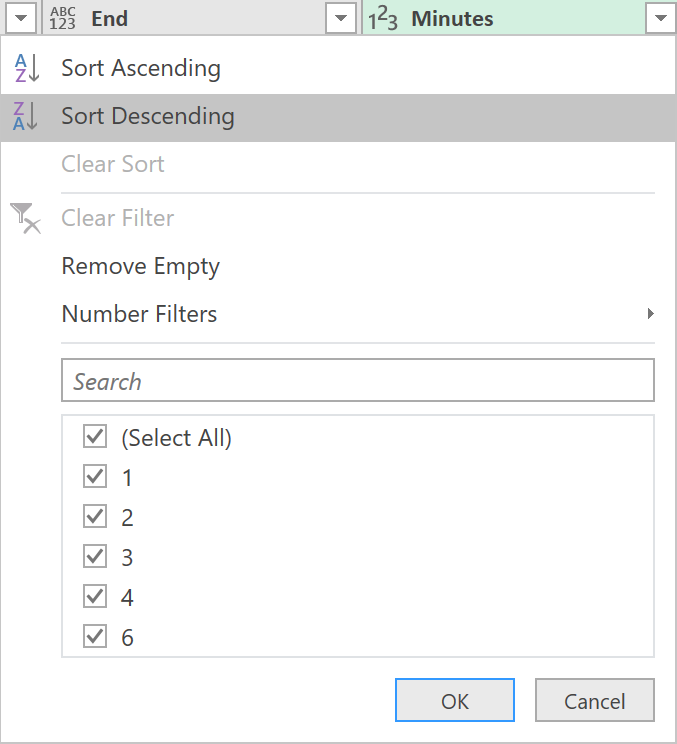
- Next, sort the table by the Minutes column in descending order by selecting that column and clicking the down arrow in that column’s header, then clicking Sort Descending, as shown below.
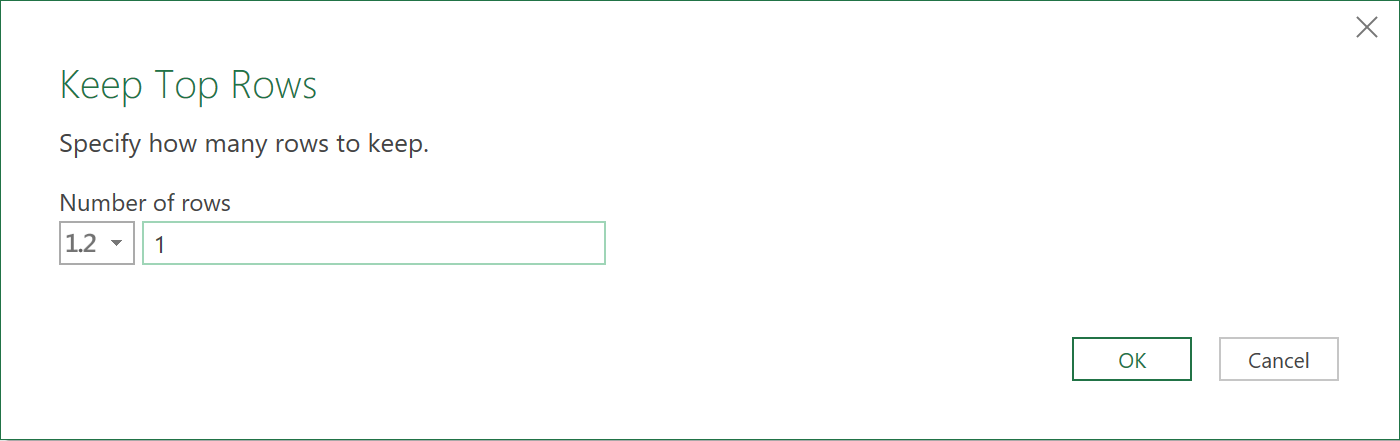
7. Keep top row only
Finally, to return only the longest time range (i.e., the time range with the largest value in the Minutes column),
- Click the Remove Rows drop-down on the Home tab in the Query Editor toolbar and select Keep Top Rows.
- When the Keep Top Rows dialog appears, enter the value 1 in the Number of rows box as shown below, and click OK.
The final output of the query will be as shown below:

8. The ‘M’ code
let
    //Load data from Excel
    Source = Excel.CurrentWorkbook(){[Name="Table1"]}[Content],
    //Set column data types
    #"Changed Type" = Table.TransformColumnTypes(Source,{{"Time", type time}, {"Stock Price", type number}}),
    #"Added Custom" = Table.AddColumn(#"Changed Type", "Above50", each [Stock Price]>=50),
    //Aggregate time ranges
    #"Grouped Rows" = Table.Group(#"Added Custom", {"Above50"}, {{"Start", each List.Min([Time]), type nullable time}, {"EndTemp", each List.Max([Time]), type nullable time}, {"Minutes", each Table.RowCount(_), Int64.Type}}, GroupKind.Local),
    //Add one minute to the values in the EndTemp column
    #"Added Custom1" = Table.AddColumn(#"Grouped Rows", "End", each [EndTemp] + #duration(0,0,1,0)),
    //Remove the EndTemp column
    #"Removed Columns" = Table.RemoveColumns(#"Added Custom1",{"EndTemp"}),
    //Move the End column in between Start and Minutes
    #"Reordered Columns" = Table.ReorderColumns(#"Removed Columns",{"Above50", "Start", "End", "Minutes"}),
    //Filter to show only ranges where stock price is greater than or equal to 50
    #"Filtered Rows" = Table.SelectRows(#"Reordered Columns", each ([Above50] = true)),
    //Sort by Minutes in descending order
    #"Sorted Rows" = Table.Sort(#"Filtered Rows",{{"Minutes", Order.Descending}}),
    //Keep first row of the table
    #"Kept First Rows" = Table.FirstN(#"Sorted Rows",1)
in
    #"Kept First Rows"
Feedback
Submit and view feedback