
Finance - Financial Planning
Overview
One of the important activities undertaken by FP&A (Financial Planning and Analysis) departments is to help the company’s Executives, and other Group-level business functions, better manage the company’s profitability, and use of its expected future cashflows.
The department carries out several different activities, including: comparing the company’s actual results to its budgets and forecasts; understanding how profit contributions and profitability of the company’s products and services compare; assessing how cost-efficiencies vary across departments; and working with the company’s Executives and Management to create a longer term forecast (3 to 5 years), that consider a range of both internal and external factors.
One of the most important goals of the department is to predict (i.e. forecast) the company’s future performance, so its Management can make best use of its expected future cash flows – to cover both its short-term (operating) expenses, and larger scale capital investment programmes - that should help the company to continue to grow, stay competitive, and meet its short and long-term strategic objectives (as they have defined by the company’s Leadership).
Source: https://corporatefinanceinstitute.com/resources/careers/jobs/financial-planning-and-analysis-fpa/
The following article goes through an example of the kind of financial data that an FP&A department might be work through, and how this data could be turned into a meanningful Financial Report - one that provides a summary of a company’s main P&L Cost lines (over different financial periods), and, separately, some Key Performance Indicators (in this example), on the company’s ‘people cost’ efficiency.
Transforming this financial data from its raw form to final report, involves several key steps:
- Importing the initial financial data from any relevant Financial ERP, into the Query Editor (used for Transforming the data)
- Designing and programming in additional steps to ensure column headings of the table are given the correct ‘Dimension’ names.
- Using a self-referencing table to allow the report preparer to use their own user-defined headings (if needed) for the processed raw data (the FACT table)
- Creating the relevant DIMENSION tables, that go along with the FACT tables.
- Importing both the FACT and DIMENSION tables into a Data Model, so any relevant KPI calculations can also be created
- Designing the appropriate Financial Tables, with information that can help a company better plan for the use of its expected future cashflows.
Step 1 – Importing the financial data into the Query Editor
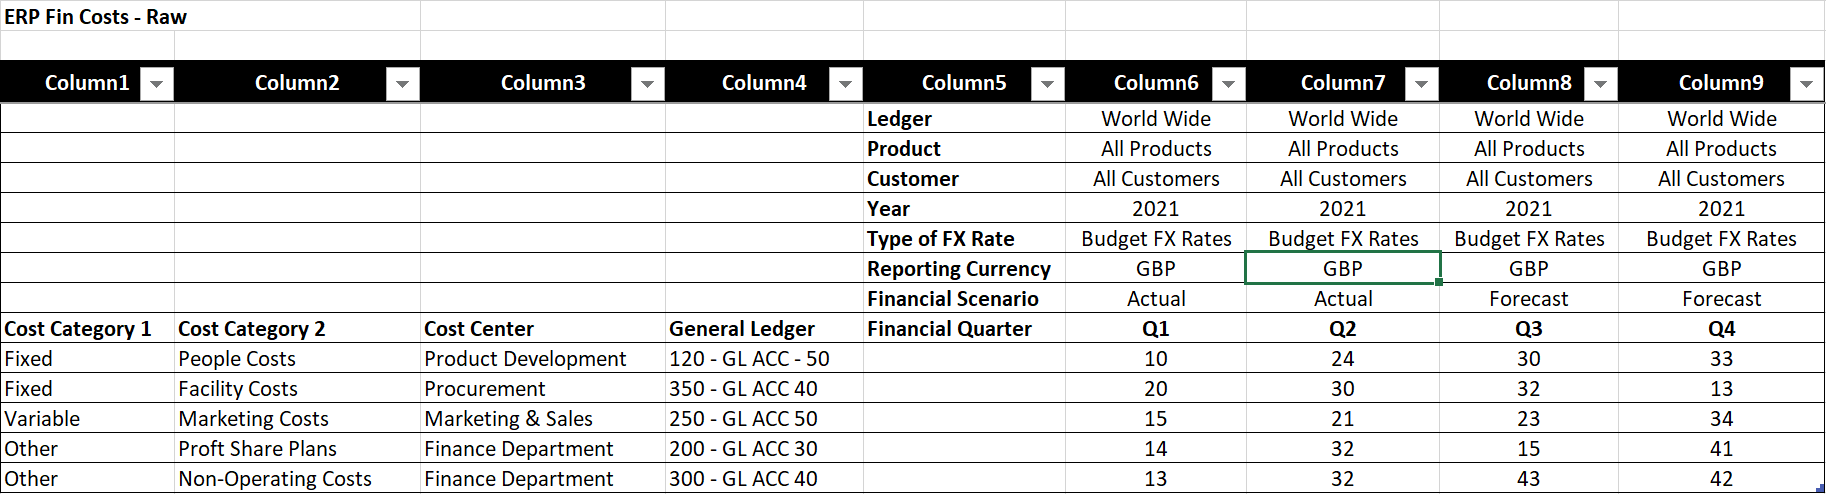
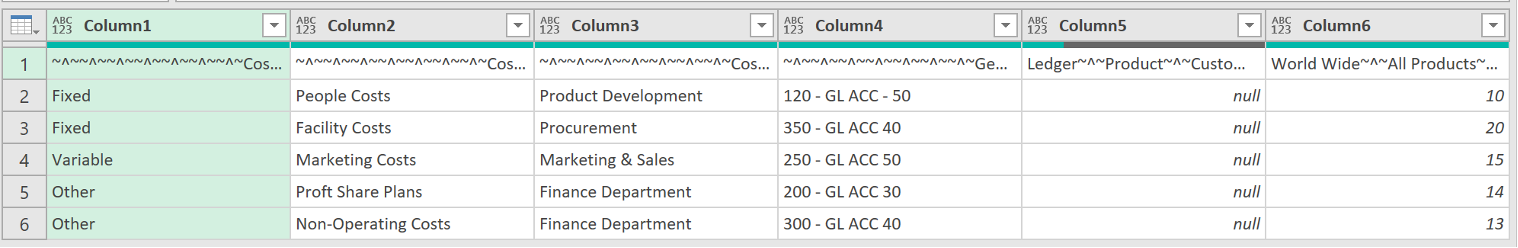
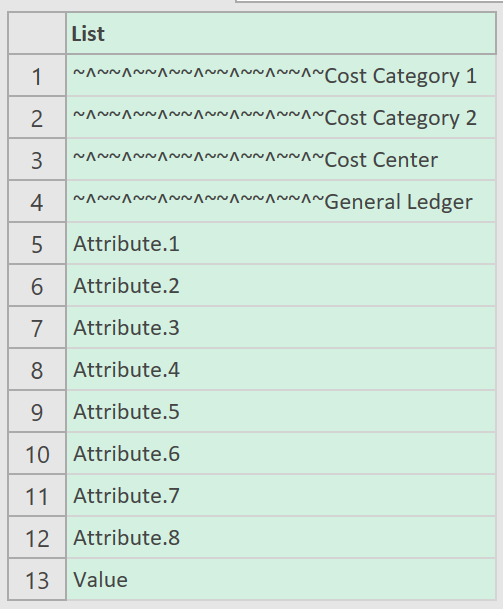
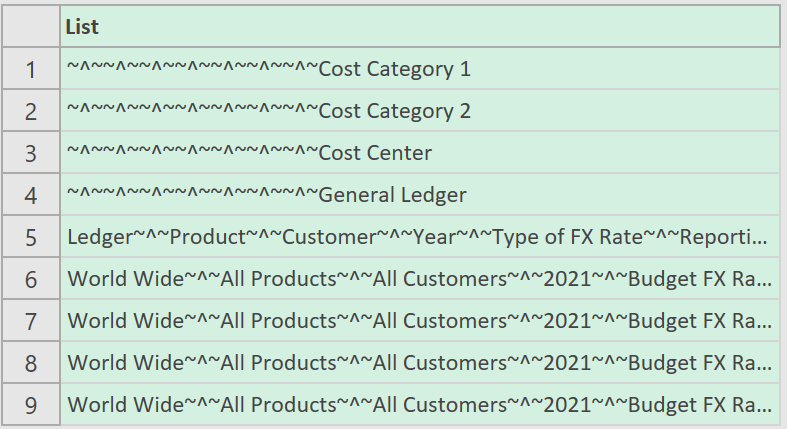
When you get the Financial data from the relevant ERP system, it might look something like this, with all the ‘Dimensions’ listed at the top for different time periods, and types of categorisations, such as Cost Center, Cost Category, shown on the left:
Click to view large-sized image
Query 1 (Fin Costs - Promoted Headers)
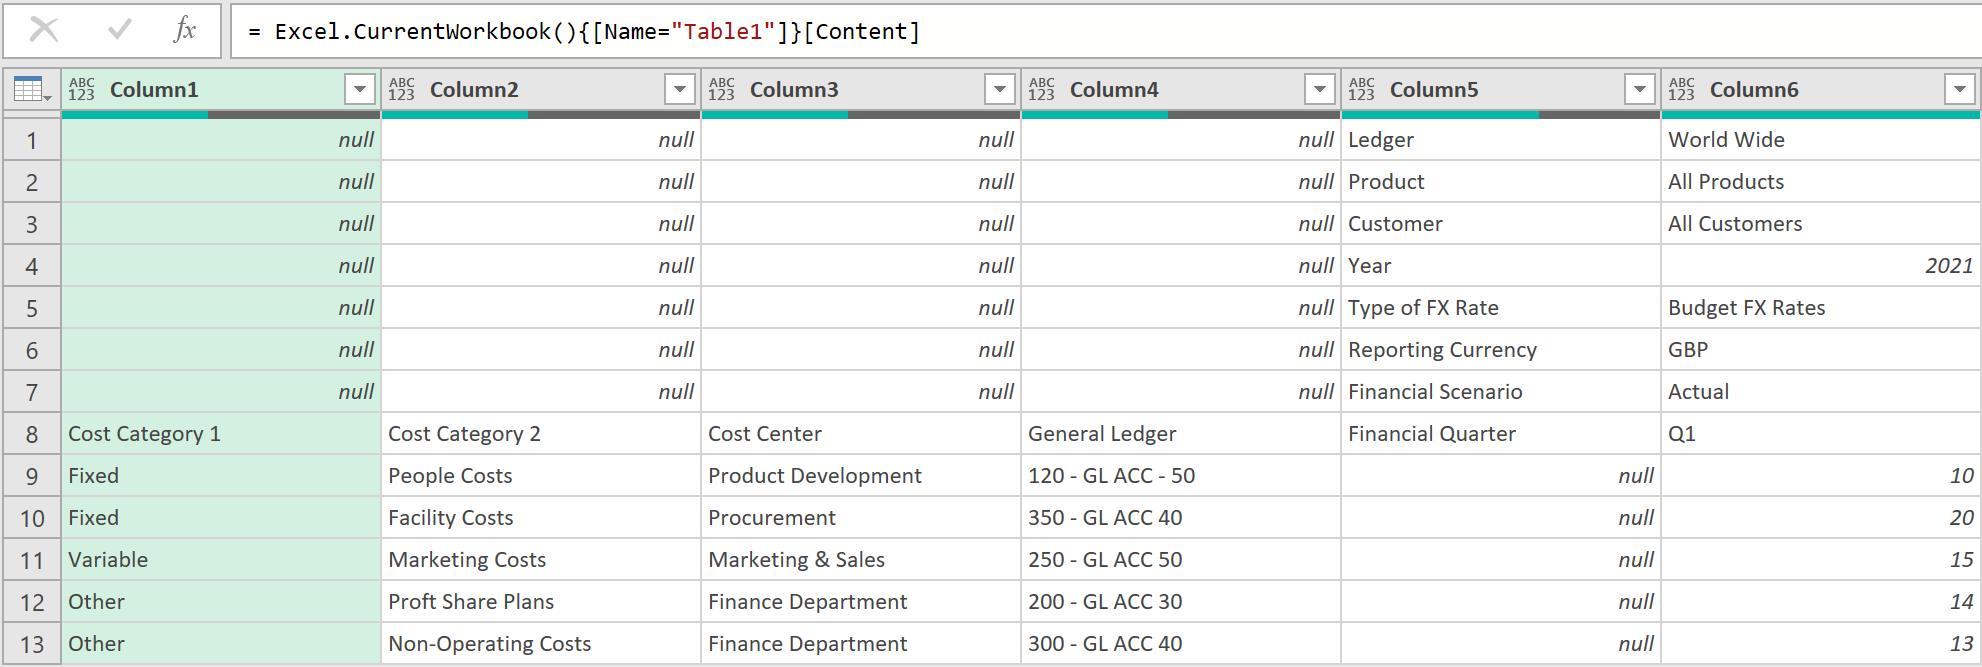
When imported into the Query Editor of MS Excel, the data should then look something like this:
Click to view large-sized image
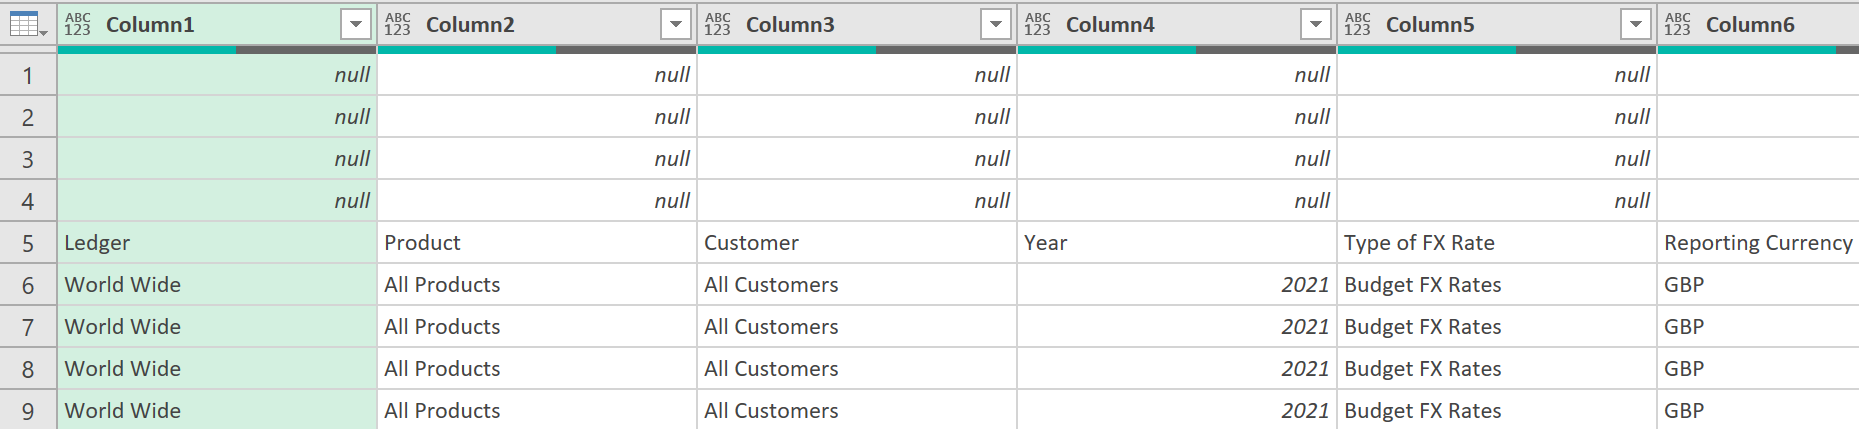
If you choose the option to Transpose the data, it will then look something like the below:
Click to view large-sized image
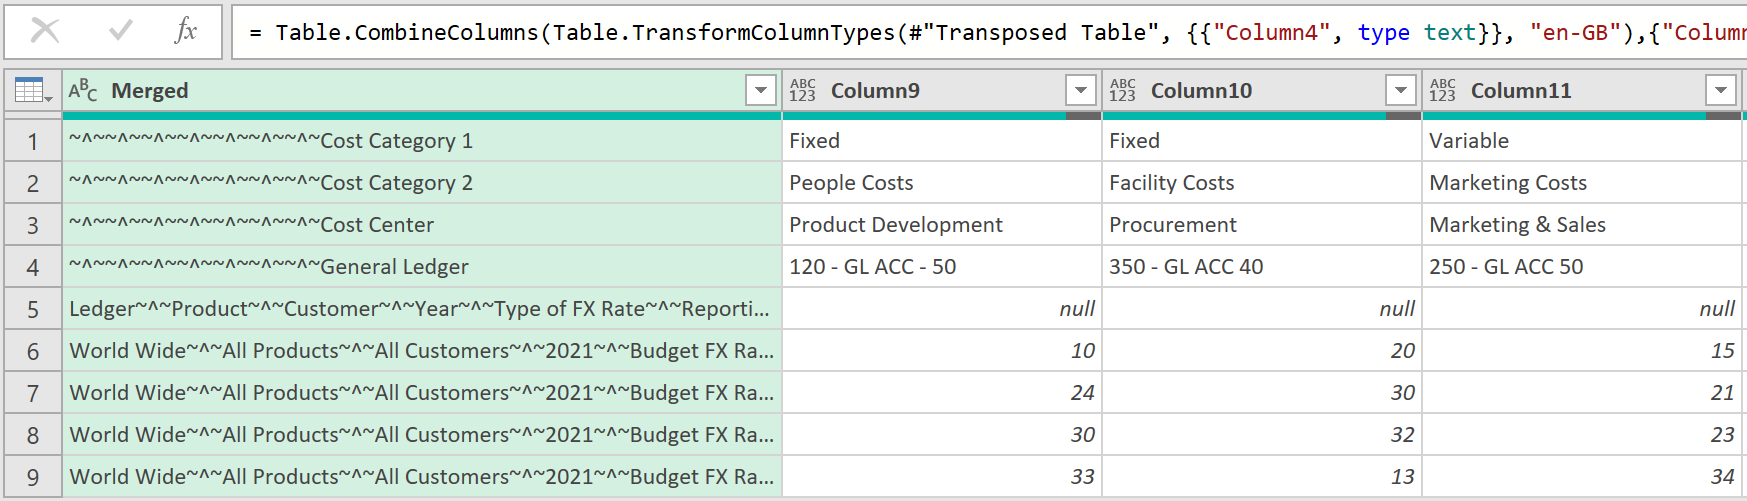
Next, if you merge all the columns in the data as it stands, from Column 1, horizontally, all the way up to the column just before where the actual amounts start, the data should look something like, in the example below, where the ‘Delimiter’, ‘~^~’ has been used to separate the Column Names from one another.
Click to view large-sized image
After transposing the data back again, the data should then look something like this:
Click to view large-sized image
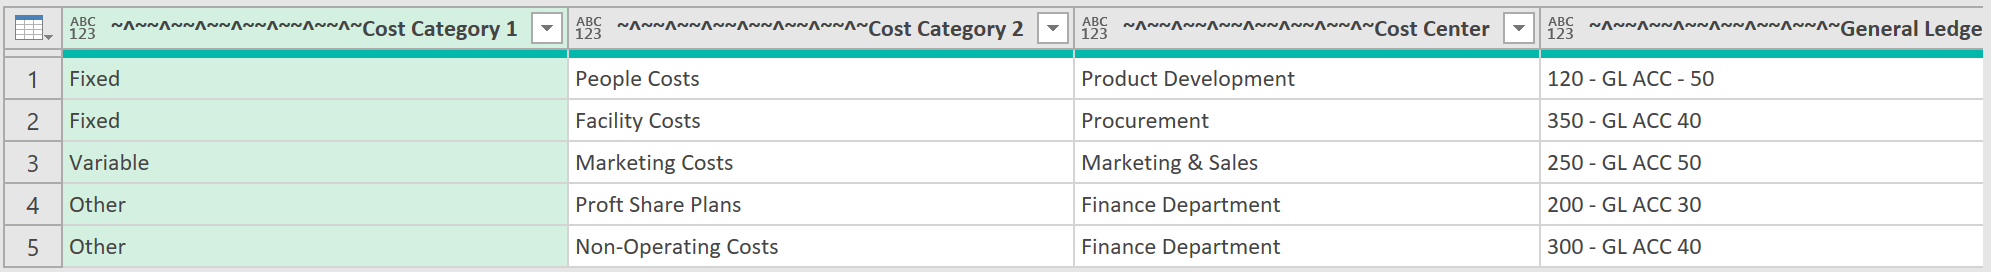
Then after promoting the headers, the data should be in the following form, with the names actually promoted to the column headings:
Click to view large-sized image
The query above has been called: Fin Costs - Promoted Headers. The following M:Code has been used:
let
    Source = #"Fin Costs -Source",
    #"Transposed Table" = Table.Transpose(Source),
    #"Merged First 8 Columns" = Table.CombineColumns(Table.TransformColumnTypes(#"Transposed Table", {{"Column4", type text}}, "en-GB"),{"Column1", "Column2", "Column3", "Column4", "Column5", "Column6", "Column7", "Column8"},Combiner.CombineTextByDelimiter("~^~", QuoteStyle.None),"Merged"),
    #"Transposed Table1" = Table.Transpose(#"Merged First 8 Columns"),
    #"Promoted Headers" = Table.PromoteHeaders(#"Transposed Table1", [PromoteAllScalars=true])
in
    #"Promoted Headers"
Step 2 – Importing the financial data into the Query Editor
Query 2 (Fin Costs - AFTER Unpivoting)
The following query Unpivots the data from the earlier query.
- The 2nd step to the query counts how many columns of data there are:
= List.Count(Table.ColumnNames(Source))
- Because it is not needed for this particular query, the fifth column from the end, whose column heading has the names of the different ‘Dimension’ field names, can be removed. This can be done as follows:
= Table.RemoveColumns(Source,{Table.ColumnNames(Source){#"No. of Columns" - 5}})
- The number of columns can then be counted again, using the following type of code:
= List.Count(Table.ColumnNames(#"Removed Columns"))
- The last 4 columns can then be unpivoted, like shown in the code below. Referencing to the columns by their position, instead of by their names, creates a more much flexible query,
= Table.Unpivot(#"Removed Columns", {Table.ColumnNames(#"Removed Columns"){#"No. of Columns 2" - 1}, Table.ColumnNames(#"Removed Columns"){#"No. of Columns 2" - 2}, Table.ColumnNames(#"Removed Columns"){#"No. of Columns 2" - 3}, Table.ColumnNames(#"Removed Columns"){#"No. of Columns 2" - 4}}, "Attribute", "Value")
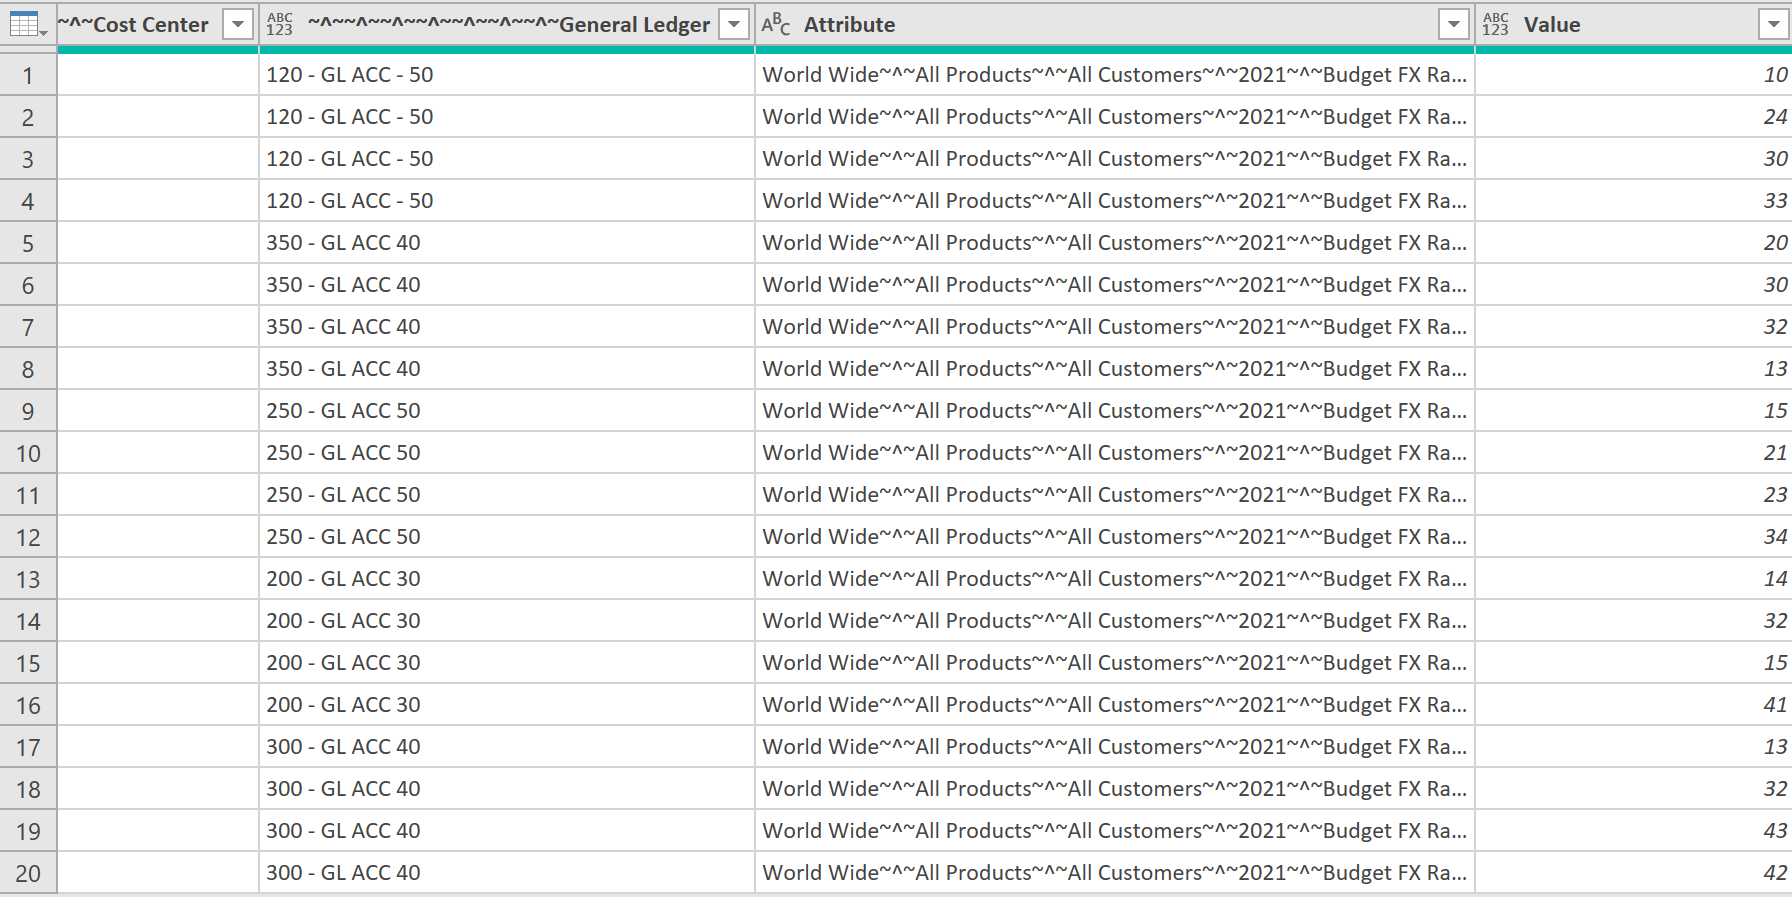
- The data should then look something like this, with the ‘Dimension’ properties (not their names) all shown in one column, called ‘Attribute’:
Click to view large-sized image
- The ‘Attribute’ column can then be separated back out into separate columns using the following code:
= Table.SplitColumn(#"Unpivoted Only Selected Columns", "Attribute", Splitter.SplitTextByDelimiter("~^~", QuoteStyle.Csv))
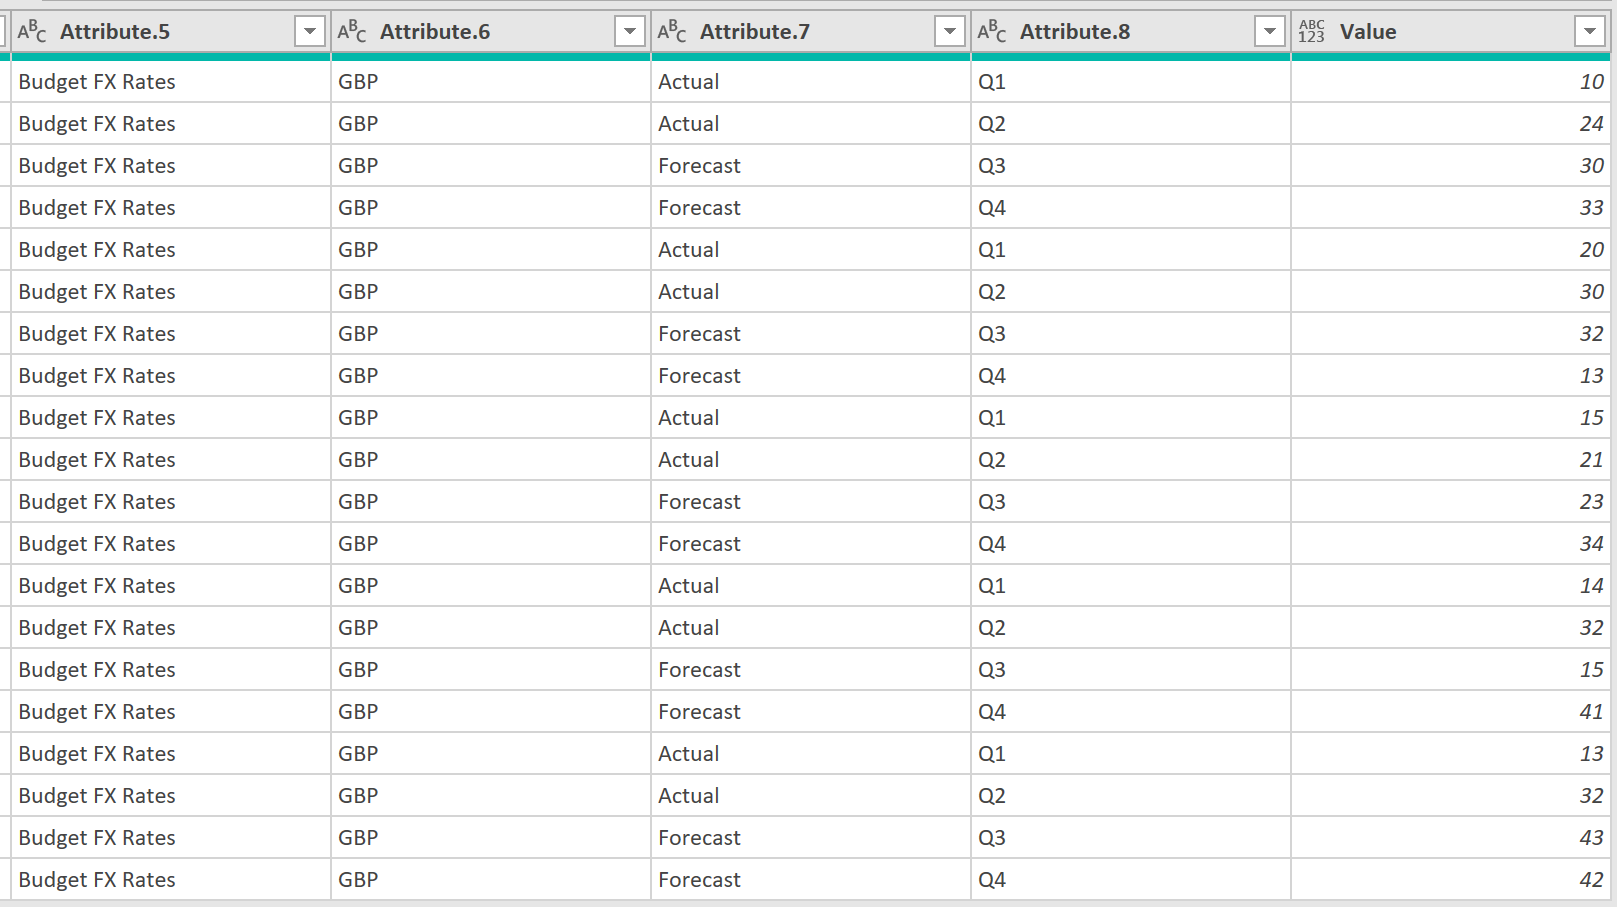
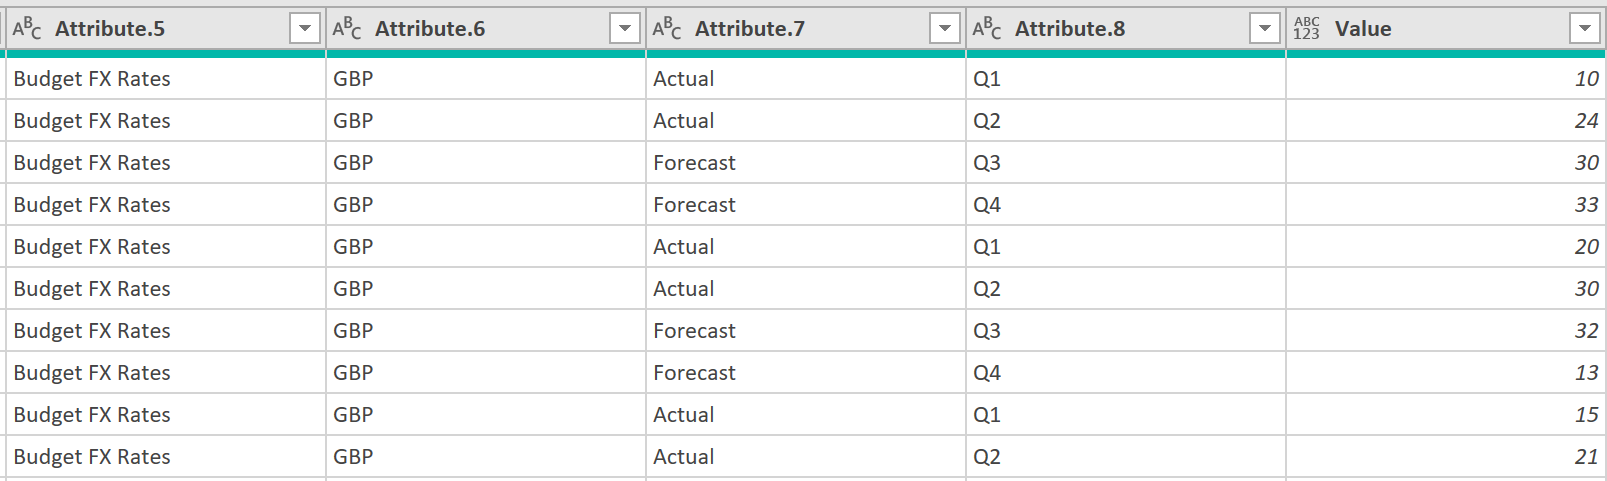
- This should result in data that looks like the below (with the ‘Dimension’* properties now shown in separate ‘Attribute’ columns):
Click to view large-sized image
- The following ‘M’-Code has been used for this query:
let
    Source = #"Fin Costs - Promoted Headers",
    #"No. of Columns" = List.Count(Table.ColumnNames(Source)),
    #"Removed Columns" = Table.RemoveColumns(Source,{Table.ColumnNames(Source){#"No. of Columns" - 5}}),
    #"No. of Columns 2" = List.Count(Table.ColumnNames(#"Removed Columns")),
    #"Unpivoted Only Selected Columns" = Table.Unpivot(#"Removed Columns", {Table.ColumnNames(#"Removed Columns"){#"No. of Columns 2" - 1}, Table.ColumnNames(#"Removed Columns"){#"No. of Columns 2" - 2}, Table.ColumnNames(#"Removed Columns"){#"No. of Columns 2" - 3}, Table.ColumnNames(#"Removed Columns"){#"No. of Columns 2" - 4}}, "Attribute", "Value"),
    #"Split Column by Delimiter" = Table.SplitColumn(#"Unpivoted Only Selected Columns", "Attribute", Splitter.SplitTextByDelimiter("~^~", QuoteStyle.Csv))
in
    #"Split Column by Delimiter"
Query 3 (List of Attribute Names)
The following query is used to isolate the names of the columns from the earlier query that have the word ‘Attribute’ in the column heading, This is needed for a later step, when these ‘Attribute’ headings need to be given the correct ‘Dimension’ names.
The sequence of steps on how to do this, is described below.
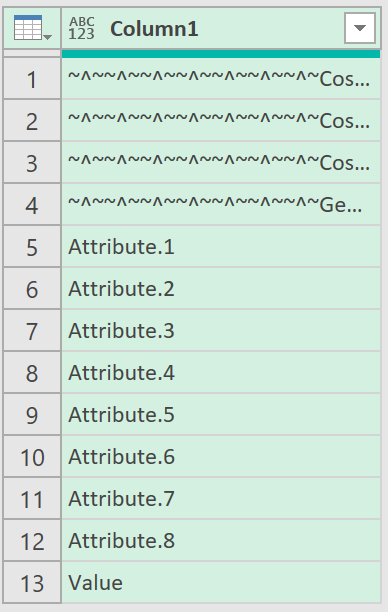
- First, all the Column Names can be listed into one list, using the following code:
= Table.ColumnNames(#"Fin Costs - AFTER Unpivoting")
Click to view large-sized image
The list can then be converted into a Table, as follows:
= Table.FromList(Source, Splitter.SplitByNothing(), null, null, ExtraValues.Error)
Click to view large-sized image
The rows can then be filtered using the following code, to only show those rows, with the word ‘Attribute’
= Table.SelectRows(#"Converted to Table", each Text.Contains([Column1], "Attribute"))
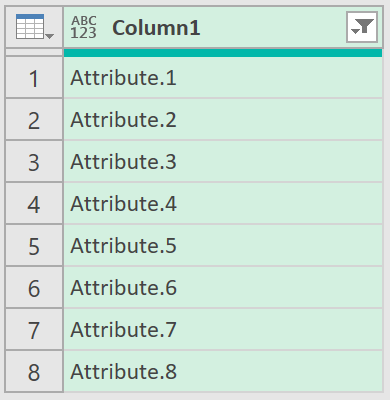
Click to view large-sized image
Finally, an INDEX column can be added:
= Table.AddIndexColumn(#"Filtered Rows", "Index", 1, 1, Int64.Type)
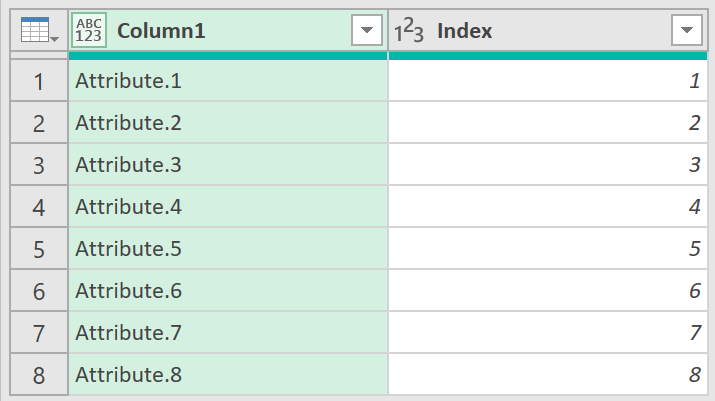
Click to view large-sized image
The following ‘M’-Code has been used for this query:
let
    Source = Table.ColumnNames(#"Fin Costs - AFTER Unpivoting"),
    #"Converted to Table" = Table.FromList(Source, Splitter.SplitByNothing(), null, null, ExtraValues.Error),
    #"Filtered Rows" = Table.SelectRows(#"Converted to Table", each Text.Contains([Column1], "Attribute")),
    #"Added Index" = Table.AddIndexColumn(#"Filtered Rows", "Index", 1, 1, Int64.Type)
in
    #"Added Index"
Query 4 (List of Dimension Names)
The following query is used to list all the ‘Dimension’ Names, onto separate rows. The sequence of steps that show how to do this are described below:
- First, list all the column names from the very first query created that ended with Promoting the column names into the Headers (So, not the second query that Unpivoted the data – as the fifth last column, which held the ‘Dimension’ names was removed)
= Table.ColumnNames(#"Fin Costs - Promoted Headers")
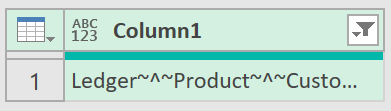
The list should look something like this:
Click to view large-sized image
- Then convert the list into a table, using the following code:
= Table.FromList(Source, Splitter.SplitByNothing(), null, null, ExtraValues.Error)
- Then filter for the row that has the ‘Dimension’ names in them. Here because, ‘Financial Scearnio’ is very likely to be at least one of the ‘Dimensions’, this is what has been used to filter to the correct row.
= Table.SelectRows(#”Converted to Table”, each Text.Contains([Column1], “Financial Scenario”))
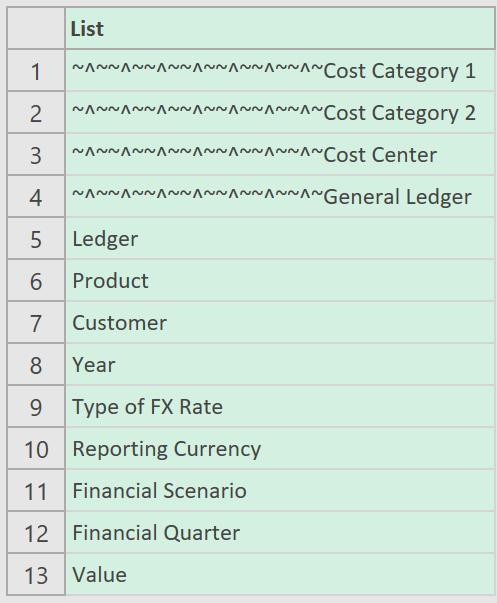
The data should then show the different ‘Dimension’ names as separate columns:
Click to view large-sized image
The column can then be split out into its separate columns, using the Delimiter “~^~”, using the following code:
= Table.SplitColumn(#"Filtered Rows", "Column1", Splitter.SplitTextByDelimiter("~^~", QuoteStyle.Csv))
The data should then look something like this:

Click to view large-sized image
After Transposing the data, and adding an INDEX column, the ‘Dimension’ names should then look as follows:
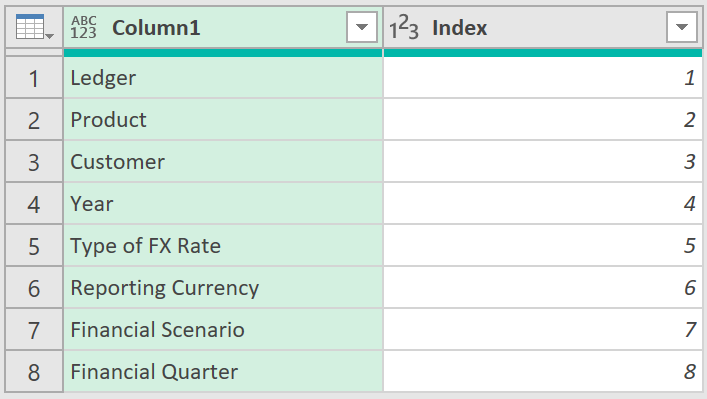
Click to view large-sized image
The following ‘M’-Code has been used for this query:
let
    Source = Table.ColumnNames(#"Fin Costs - Promoted Headers"),
    #"Converted to Table" = Table.FromList(Source, Splitter.SplitByNothing(), null, null, ExtraValues.Error),
    #"Filtered Rows" = Table.SelectRows(#"Converted to Table", each Text.Contains([Column1], "Financial Scenario")),
    #"Split Column by Delimiter" = Table.SplitColumn(#"Filtered Rows", "Column1", Splitter.SplitTextByDelimiter("~^~", QuoteStyle.Csv)),
    #"Transposed Table" = Table.Transpose(#"Split Column by Delimiter"),
    #"Added Index" = Table.AddIndexColumn(#"Transposed Table", "Index", 1, 1, Int64.Type)
in
    #"Added Index"
Warning:
There may be an upper limit to the column name fields in Power Query.
This may be upto 1020 characters. So please check that the Query works fully for you first.
Query 5 (Mapping of Attributes to Dimensions)
The query creates a small mapping table that can be used to rename the column headings, from the earlier Unpivoted Dataset.
- The query first references back to the step that showed the ‘list of attributes’
= #"List of Attribute Names"

Click to view large-sized image
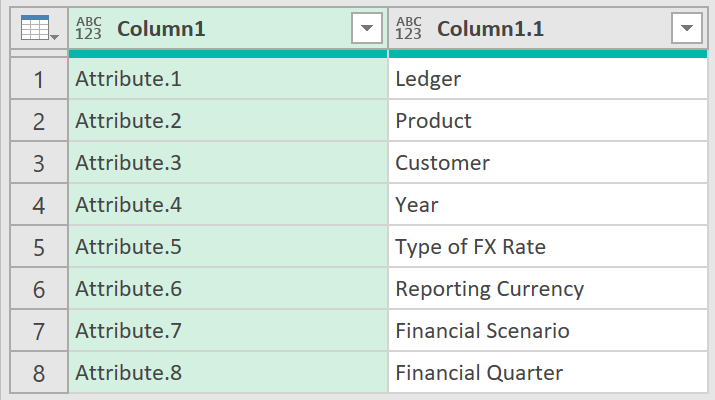
- This is then merged with the ‘list of dimensions’ created earlier through the INDEX column
= Table.NestedJoin(Source, {"Index"}, #"List of Dimension Names", {"Index"}, "List of Dimension Names", JoinKind.LeftOuter)
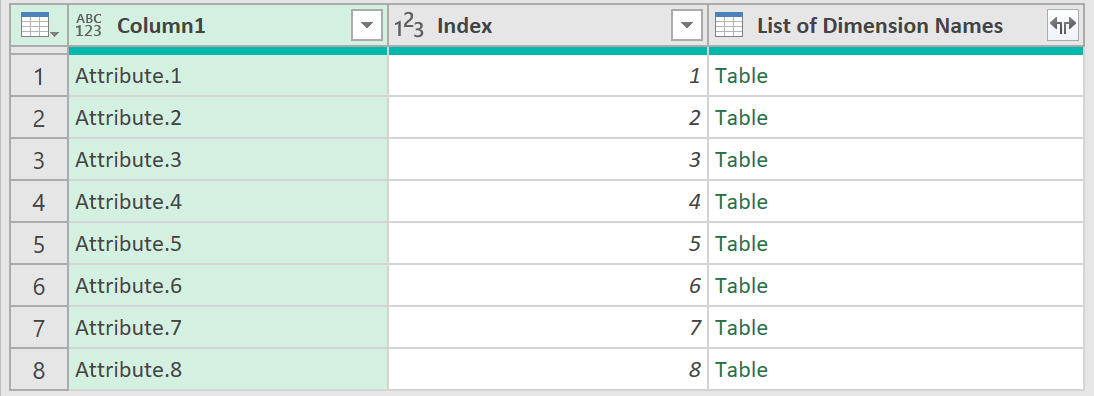
Click to view large-sized image
- The Index column itself can then be removed after the merge, as it is no longer needed
= Table.RemoveColumns(#"Expanded List of Dimension Names",{"Index"})
Click to view large-sized image
- The data can then be transposed
= Table.Transpose(#"Removed Columns")

Click to view large-sized image
- Then finally, a list of lists created
= Table.ToColumns(#"Transposed Table")
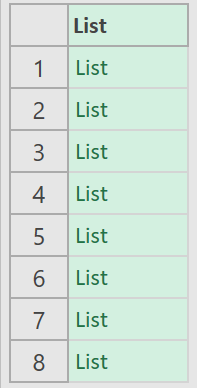
Click to view large-sized image
The M: Code for this query can be found here:
let
    Source = #"List of Attribute Names",
    #"Merged Queries" = Table.NestedJoin(Source, {"Index"}, #"List of Dimension Names", {"Index"}, "List of Dimension Names", JoinKind.LeftOuter),
    #"Expanded List of Dimension Names" = Table.ExpandTableColumn(#"Merged Queries", "List of Dimension Names", {"Column1"}, {"Column1.1"}),
    #"Removed Columns" = Table.RemoveColumns(#"Expanded List of Dimension Names",{"Index"}),
    #"Transposed Table" = Table.Transpose(#"Removed Columns"),
    #"List of Lists" = Table.ToColumns(#"Transposed Table")
in
    #"List of Lists"
Query 6 (Fin Costs - AFTER ATTR Renaming)
This query uses the mapping table created earlier, to give the column headers in the query: ‘Fin Costs – AFTER Unpivoting’ the correct ‘Dimension’ names
- The query first references back to the query with the unpivoted data, as shown below:
= #"Fin Costs - AFTER Unpivoting"
Click to view large-sized image
- The following step then uses the information in the Mapping table, to give each column the correct name:
= Table.RenameColumns(Source, #"Mapping of Attribute to Dimensions")
The resulting query is shown below:
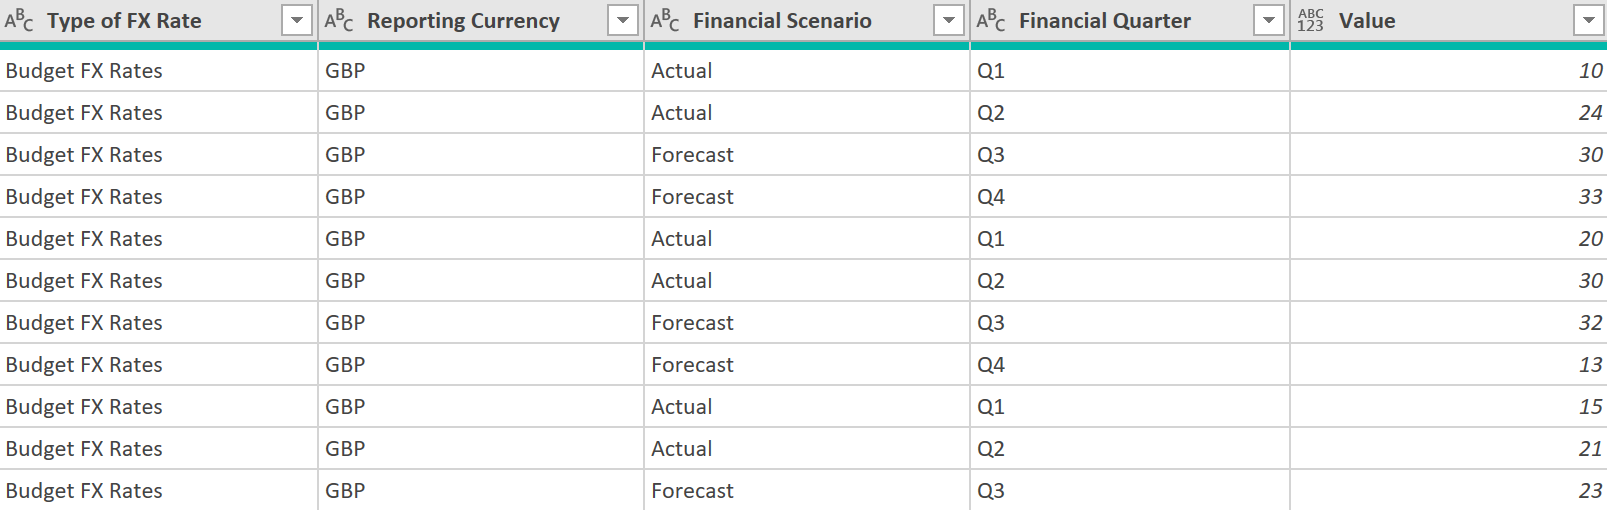
Click to view large-sized image
let
    Source = #"Fin Costs - AFTER Unpivoting",
    Custom1 = Table.RenameColumns(Source, #"Mapping of Attribute to Dimensions")
in
    Custom1
Step 3 – Importing the financial data into the Query Editor
Query 7 (List of Columns with DMS Names)
This and the next two queries are created in case the preparer of the report wants to user their own ‘User-defined’ versions of the ‘Dimension’ Names.
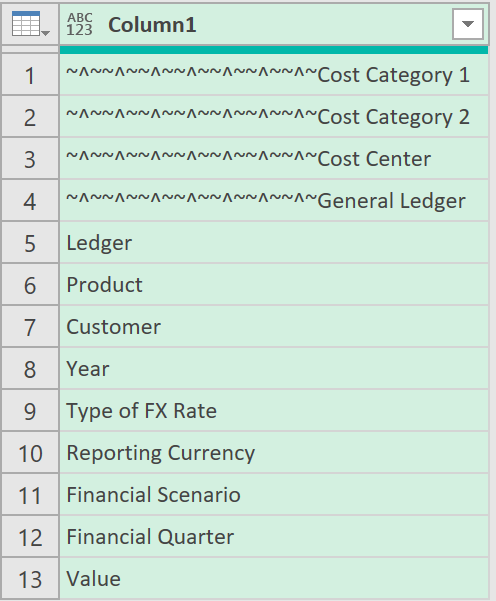
- This shows a list of the column names, from the query, after the columns had been given their correct ‘Dimension’ names.
= Table.ColumnNames(#"Fin Costs - AFTER ATTR Renaming")
Click to view large-sized image
- The list can then be converted into a Table, like in the one shown below:
= Table.FromList(Source, Splitter.SplitByNothing(), null, null, ExtraValues.Error)
Click to view large-sized image
- The table column can then be given the appropriate column name. Below we have changed the text ‘Column1’ to ‘Column Headings’
= Table.RenameColumns(#"Converted to Table",{{"Column1", "Column Headings"}})
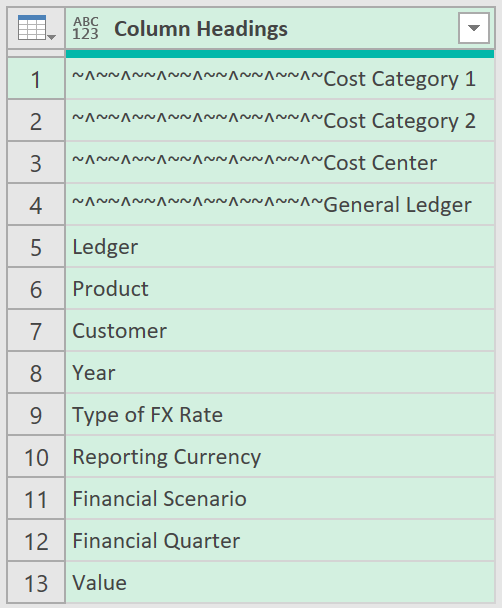
Click to view large-sized image
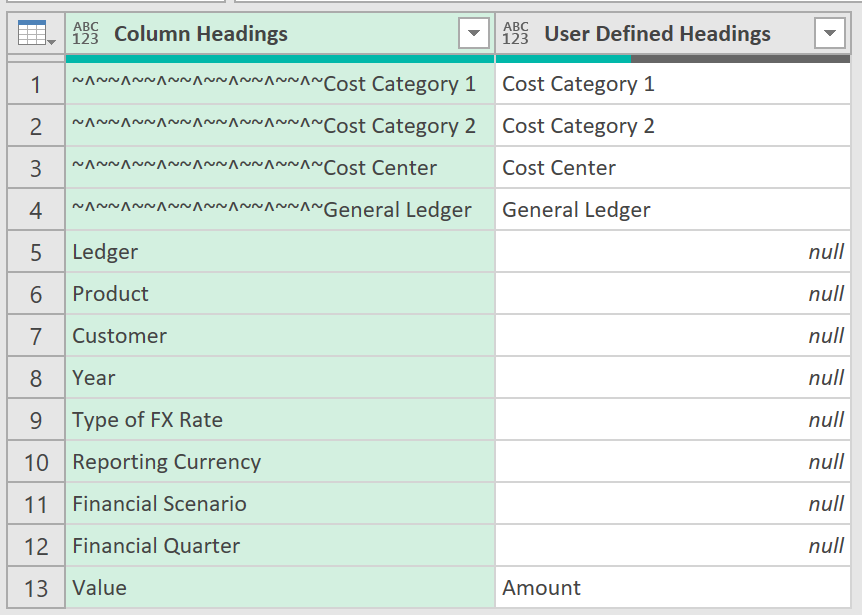
At this step in the Query, the query can then be exported out back into an MS Excel worksheet. When it is, the table should look something like this:
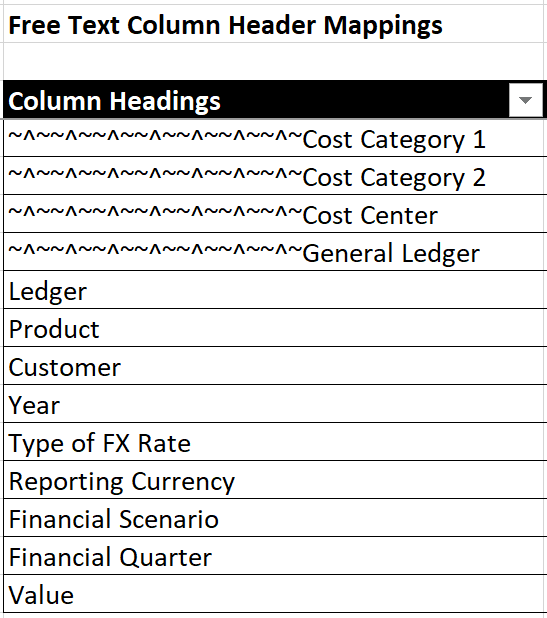
Click to view large-sized image
A column can then be added adjacent to it, and the user defined columns then given the desired names.
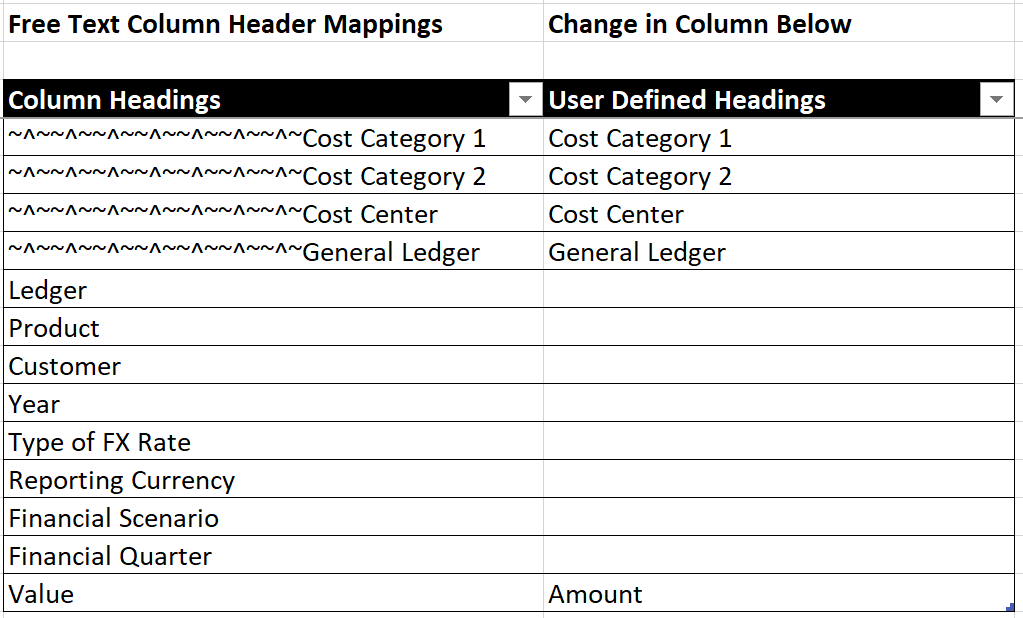
Click to view large-sized image
At this point, the table, with both columns can then be re-imported into the Query Editor, as a new Query (this is separate to Query 7 which was the Query that exported the Table back out into MS Excel), like shown below:
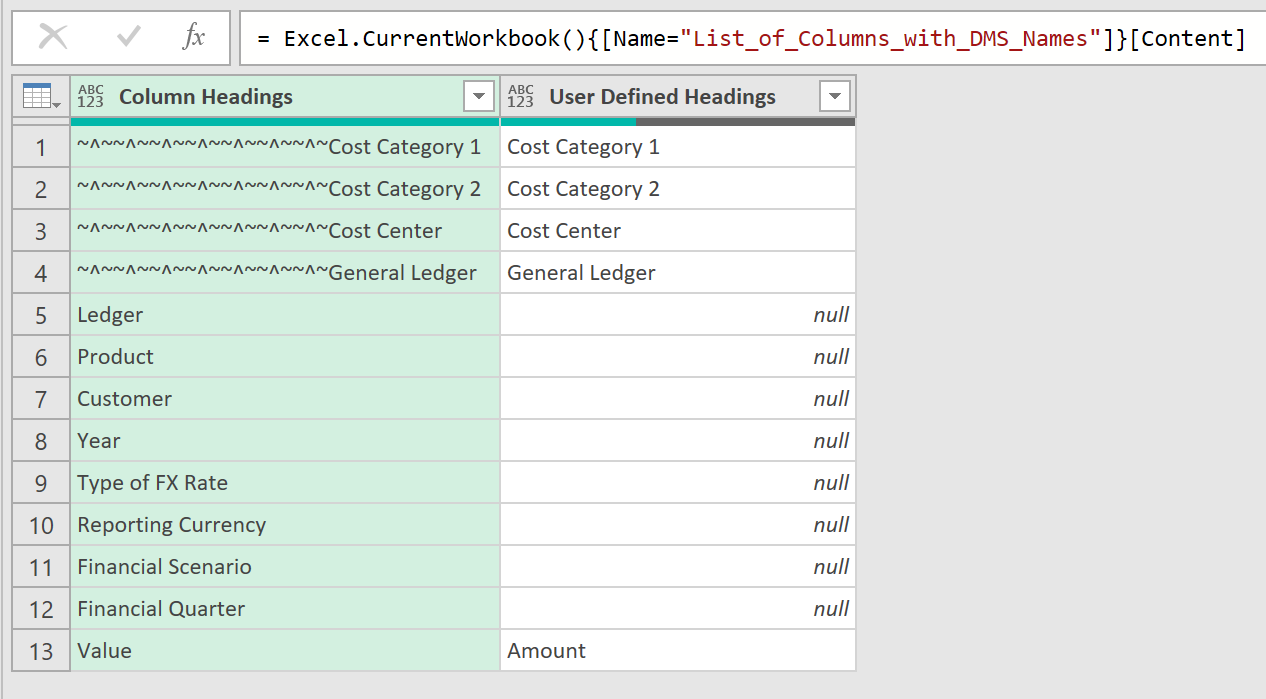
Click to view large-sized image
The Table in this query then needs to be logically linked back to the earlier step in Query 7, where the column Name had been renamed to ‘Column Headings’, like shown below:
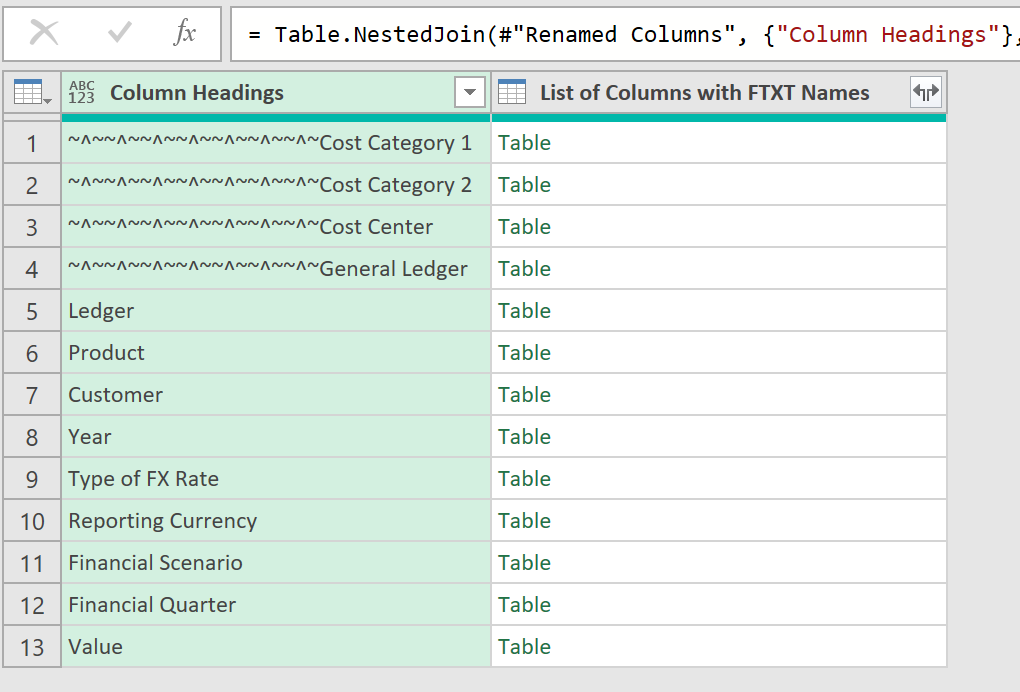
Click to view large-sized image
The user defined column names can then be merged back to the correct row, based on the text descriptions in the column, ‘Column Headings’
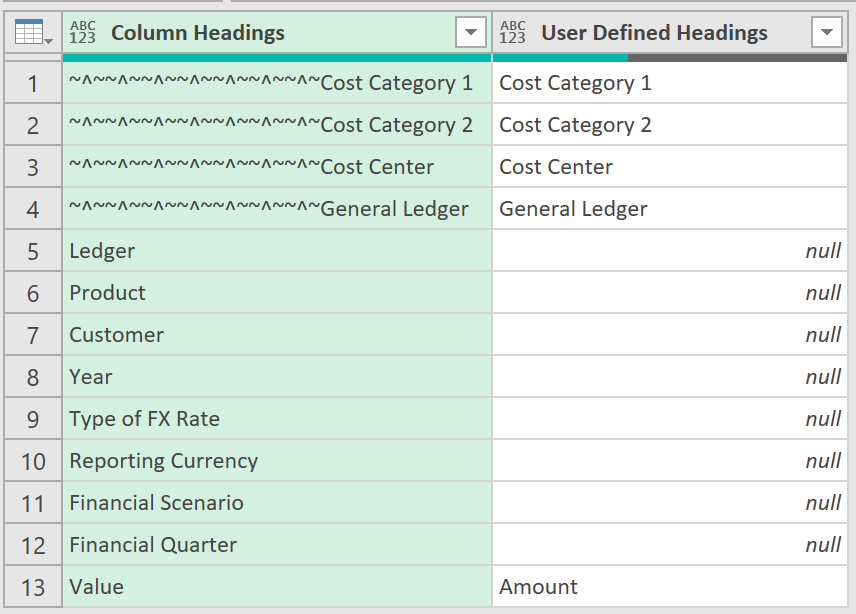
Click to view large-sized image
The following M:Code has been used for this Query:
let
    Source = Table.ColumnNames(#"Fin Costs - AFTER ATTR Renaming"),
    #"Converted to Table" = Table.FromList(Source, Splitter.SplitByNothing(), null, null, ExtraValues.Error),
    #"Renamed Columns" = Table.RenameColumns(#"Converted to Table",{{"Column1", "Column Headings"}}),
    #"Merged Queries" = Table.NestedJoin(#"Renamed Columns", {"Column Headings"}, #"List of Columns with FTXT Names", {"Column Headings"}, "List of Columns with FTXT Names", JoinKind.LeftOuter),
    #"Expanded List of Columns with FTXT Names" = Table.ExpandTableColumn(#"Merged Queries", "List of Columns with FTXT Names", {"User Defined Headings"}, {"User Defined Headings"})
in
    #"Expanded List of Columns with FTXT Names"
Query 8 (List of Columns with FTXT Names)
See the earlier Query, Query 7
Query 9 (Mapping of DMS Names to FTXT Names)
This query creates a small mapping table that can be used to rename the columns of data from the original ‘Dimension’ names, to the ‘User-defined’ names.
- It first references back to last step of Query 7
Click to view large-sized image
A conditional column has then been added to show what the final names to all the Column Headings should be:
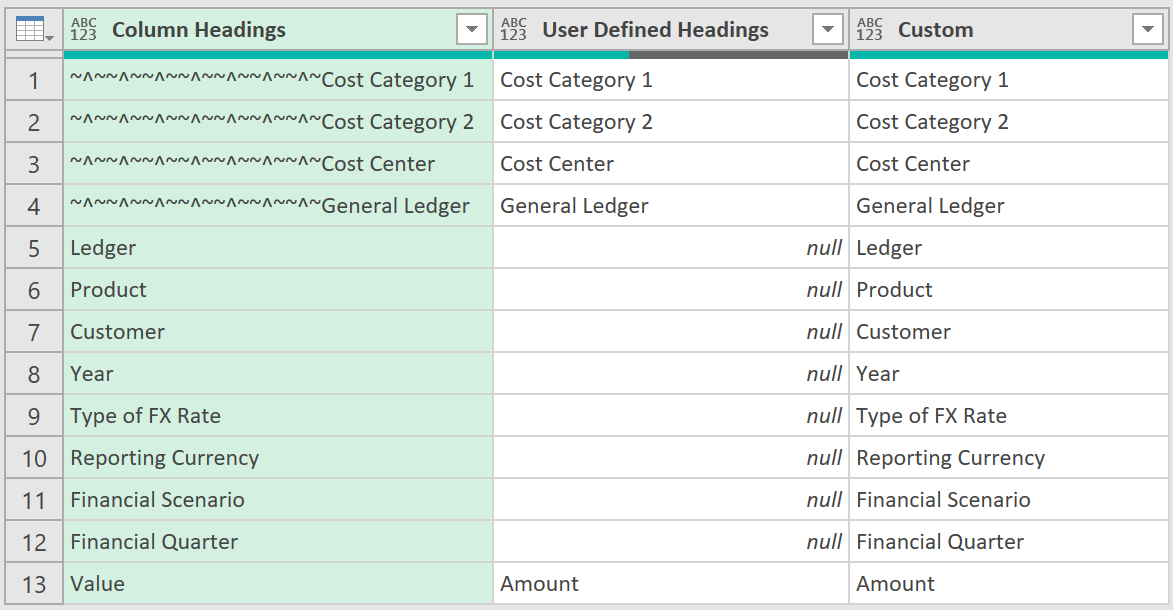
Click to view large-sized image
The middle column can then be removed, and remaining two columns transposed, so the data looks like this:

Click to view large-sized image
- And finally, these columns can be converted into a list of lists, using the Table.ToColumns function – that will be used to do the final renamings
= Table.ToColumns(#"Transposed Table")
The final M-Code to this query can be found here:
let
    Source = #"List of Columns with FTXT Names",
    #"Added Conditional Column" = Table.AddColumn(Source, "Custom", each if [User Defined Headings] = null then [Column Headings] else [User Defined Headings]),
    #"Removed Columns" = Table.RemoveColumns(#"Added Conditional Column",{"User Defined Headings"}),
    #"Transposed Table" = Table.Transpose(#"Removed Columns"),
    #"List of Lists" = Table.ToColumns(#"Transposed Table")
in
    #"List of Lists"
Query 10 (Fin Costs - AFTER FTXT Renaming)
- This query references back to the query that renamed the columns that had the text ‘Attribute’ in them, and which then gave them the correct ‘Dimension’ name

Click to view large-sized image
- It then overwrites the column headings for any user-defined names, using the ‘DMS to FTXT’ mapping table, created earlier
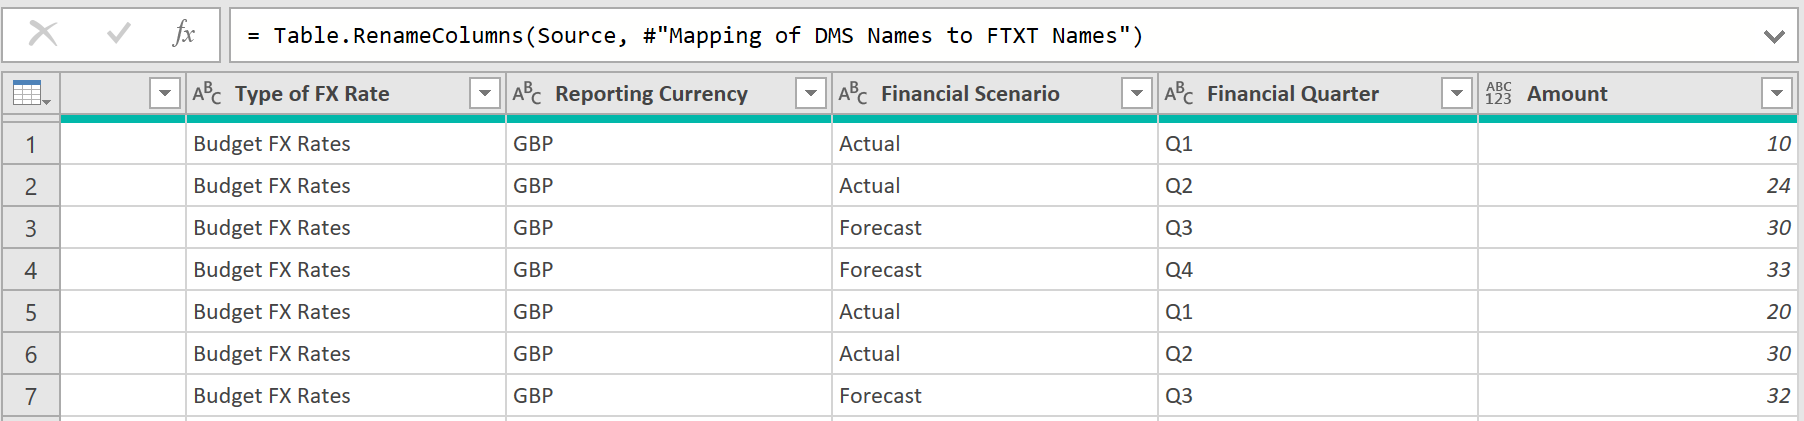
Click to view large-sized image
The final M-Code to this Query can be found here:
let
    Source = Excel.CurrentWorkbook(){[Name="HR_HeadCount___AFTER_FTXT_Renaming"]}[Content],
    #"Set Data Type to HeadCount" = Table.TransformColumnTypes(Source,{{Table.ColumnNames(Source){List.Count(Table.ColumnNames(Source))-1}, type number}})
in
    #"Set Data Type to HeadCount"
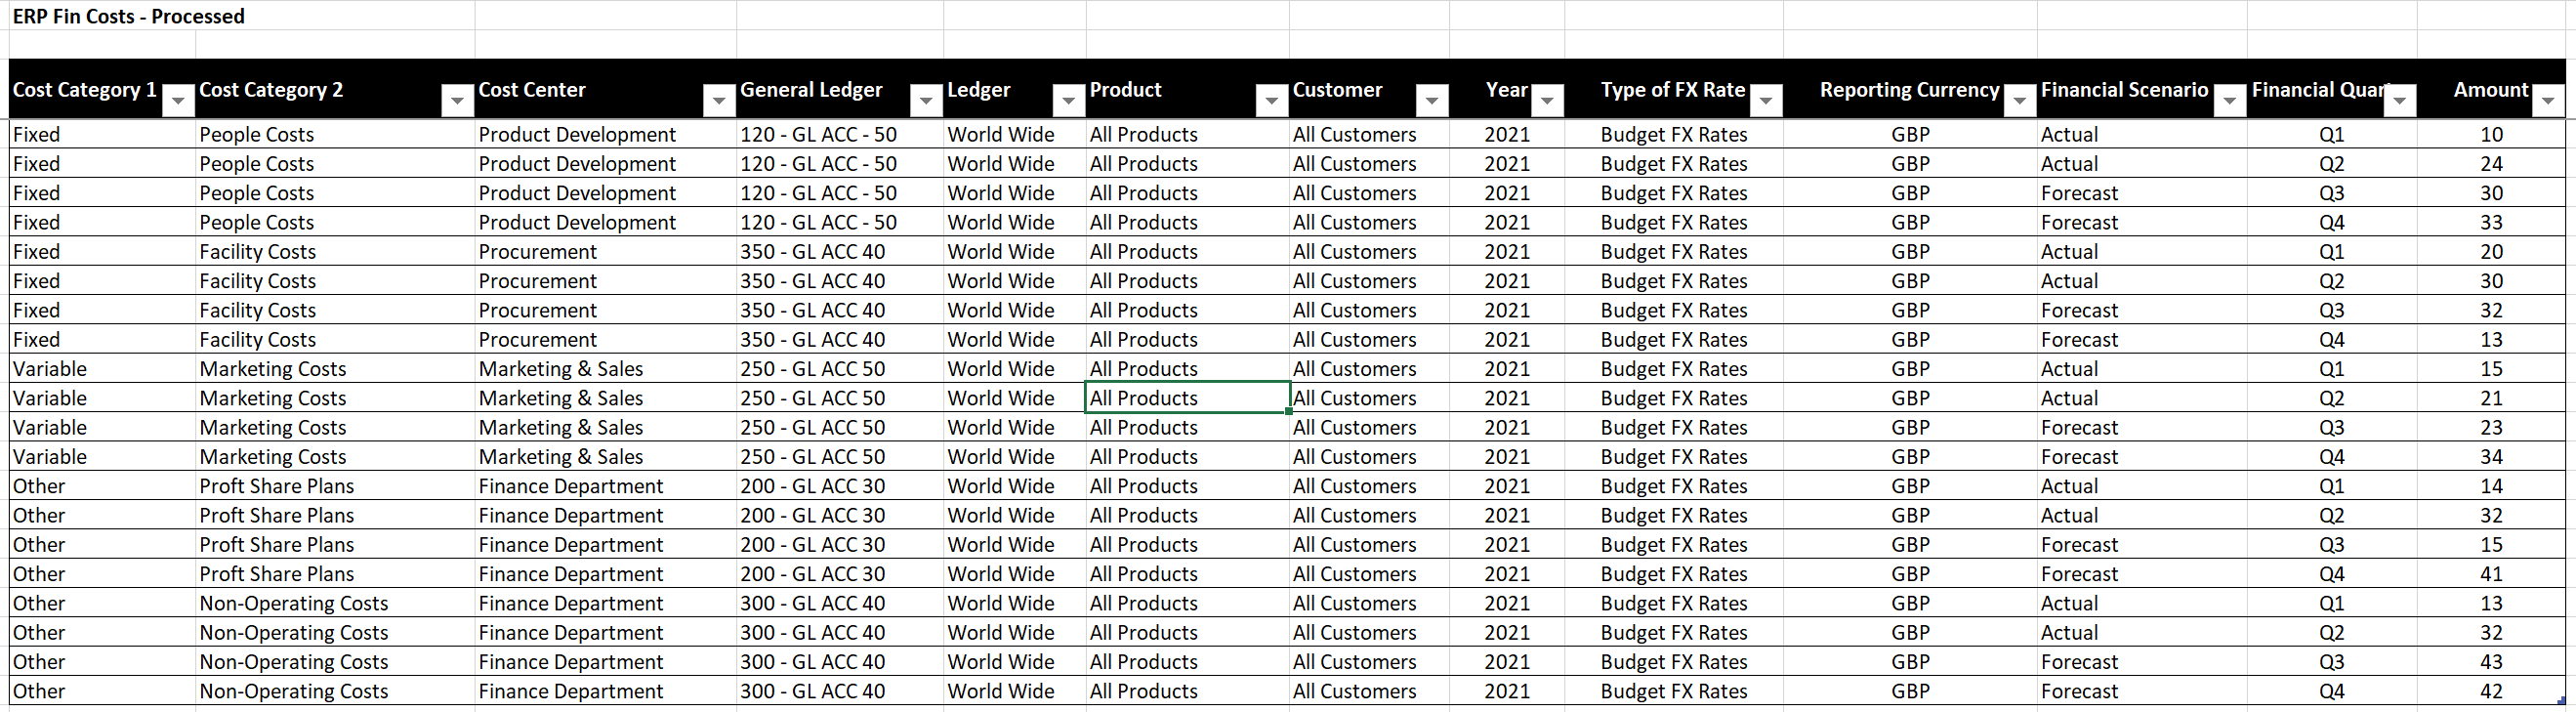
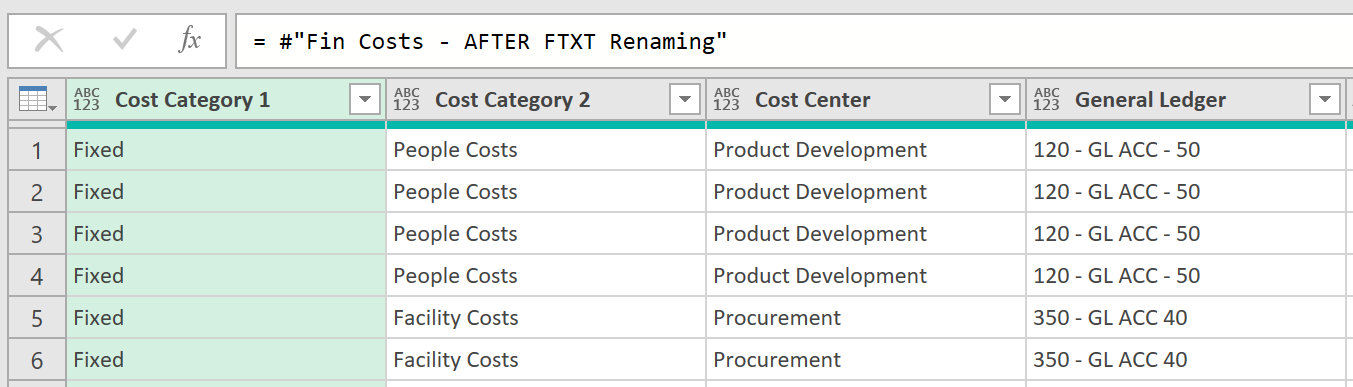
Final FACT Table
The final transformed Dataset when loaded back to a worksheet in MS Excel, should then be in the following form, which can be more easily examined, and from which insights can be more easily drawn.
Click to view large-sized image
Step 4 – Creating the relevant Dimension Tables
For the Data Model needed to show the required Financial Information, in addition to the FACT table just created, the DIMENSION tables also need to be created – in this case, a Dimension table that shows a list of all ‘Cost Centers’, and another Dimension table that shows a list of all ‘Financial Quarters’
List of all Cost Centers
This can be created by referencing to the earlier FACT table, like shown below:
Click to view large-sized image
To this you might have similar data from other FACT tables, showing things such as numbers of actual Staff, i.e. HeadCounts, like the example FACT table shown below:
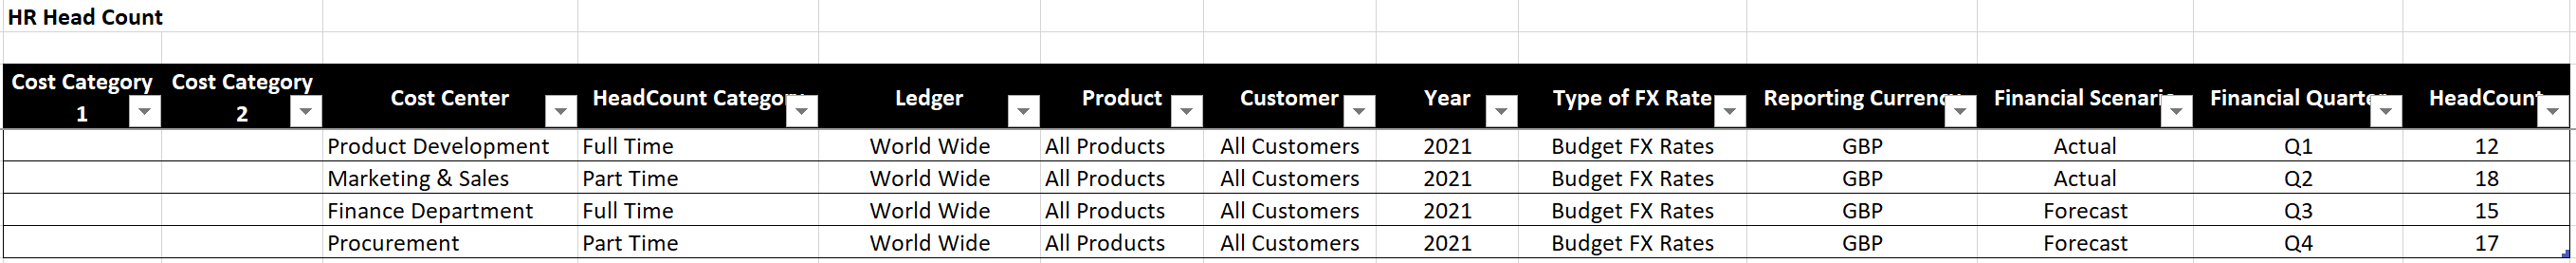
Click to view large-sized image
Appending various FACT tables together ensures that the list of ‘Cost Centers’ is a complete list, and not just those from one particular FACT table.
After the two FACT tables have been appended (the one on Financial Costs, and the other on HeadCounts), the ‘Cost Center’ column can then be isolated, like shown below:
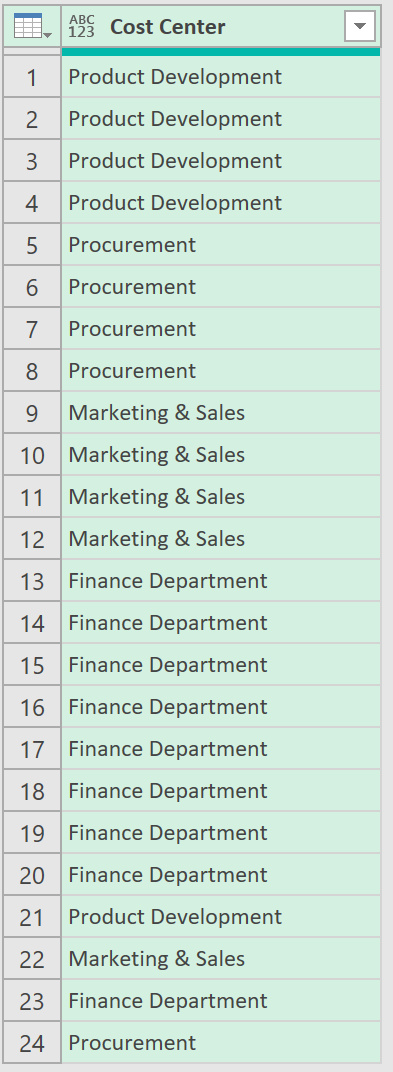
Click to view large-sized image
Duplicates can then be removed:
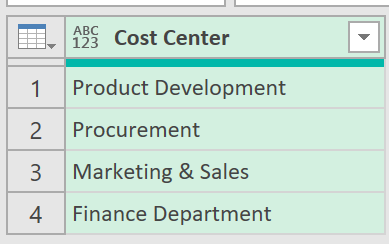
Click to view large-sized image
This can then be exported back out into a worksheet in MS Excel.
List of all Quarters
For creating a list of Quarters, a separate query does not have to be created, as these can just be defined by the user, directly as a separate table in an Excel worksheet, that lists all the Financial Quarters in the year, like the one shown below. (Also shown are the list of Cost Centers from the query that was created earlier).
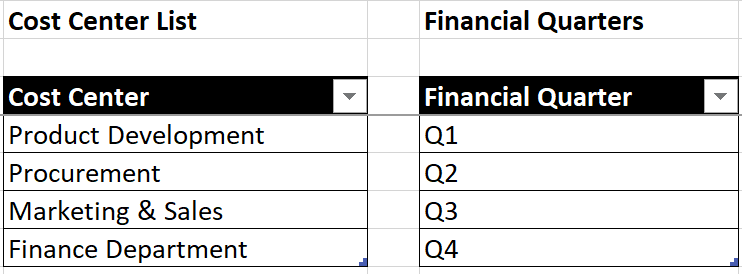
Click to view large-sized image
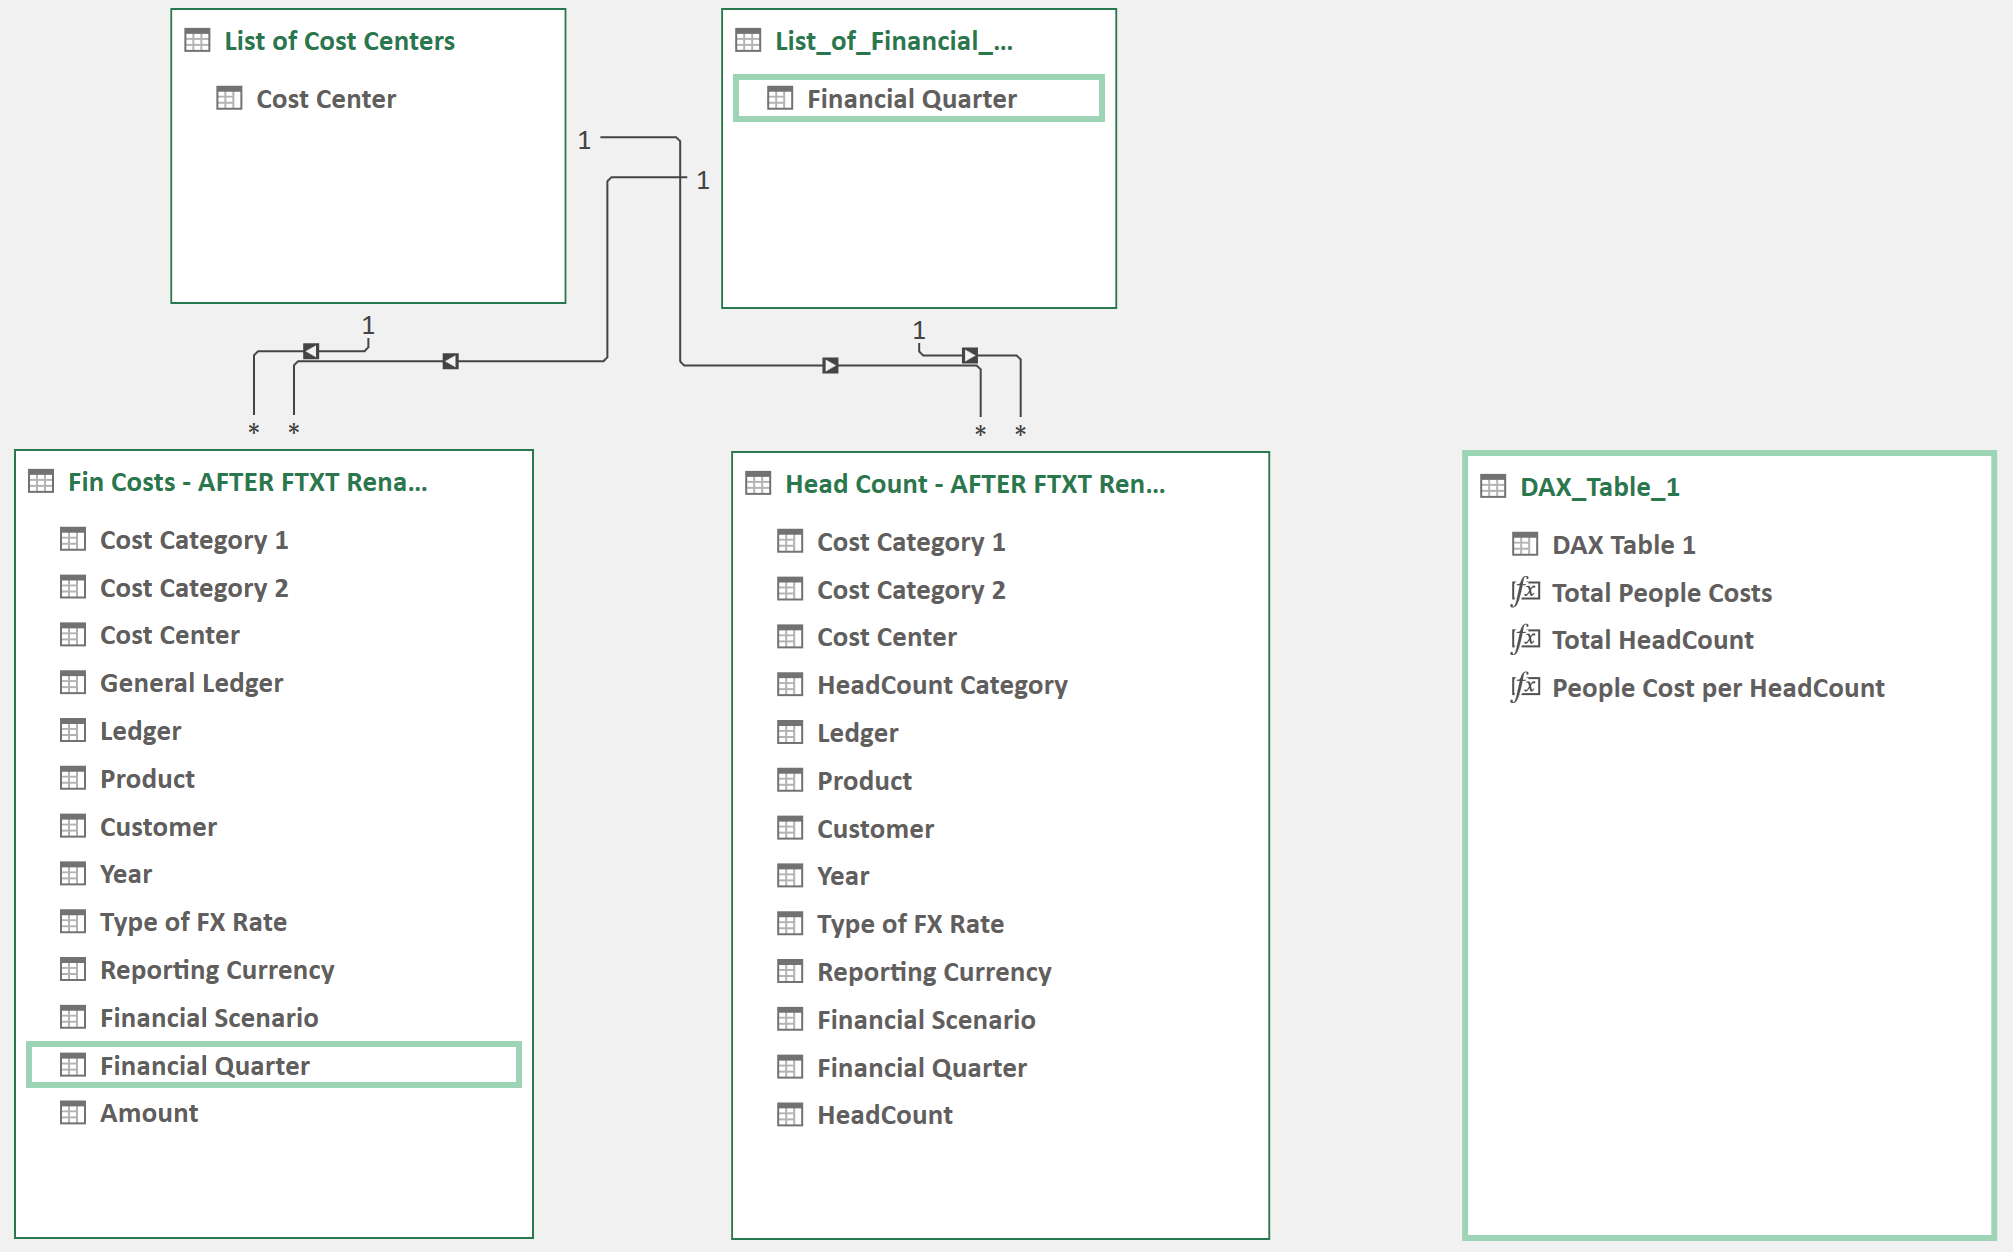
Step 5 – FACT and DIMENSION tables into the DATA MODEL
After the FACT, and DIMENSION tables have been created, these can then be imported into the DATA MODEL, so the relevant KPI calculations can then be created. The picture below shows what this Data Model could look like, along with how the Data fields connect from the DIMENSION tables to the two main FACT tables
Diagram of Data Model
Click to view large-sized image
KPI Measures
Three measures have also been created to show, example KPI measures, such as:
- Total People Costs (e.g. Salaries, Pensions, Tax Payments, Bonuses, etc.)
- Total Head Count (e.g. Full Time, Part Time, Intern, etc.)
- People Costs / Head Count (an example of a cost-efficiency ratio)
The DAX formulas used to create these measures are shown below:
Total People Costs :=
CALCULATE (
    SUM ( 'Fin Costs - AFTER FTXT Renaming'[Amount] ),
    'Fin Costs - AFTER FTXT Renaming'[Cost Category 2] = "People Costs"
)
Total HeadCount :=
VAR HeadCount =
    CALCULATE ( SUM ( 'Head Count - AFTER FTXT Renaming'[HeadCount] ) )
RETURN
    IF (
        ISFILTERED ( List_of_Financial_Quarters[Financial Quarter] ),
        HeadCount,
        AVERAGEX (
            ADDCOLUMNS (
                GROUPBY (
                    'Head Count - AFTER FTXT Renaming',
                    List_of_Financial_Quarters[Financial Quarter]
                ),
                "HeadCount", CALCULATE ( SUM ( 'Head Count - AFTER FTXT Renaming'[HeadCount] ) )
            ),
            [HeadCount]
        )
    )
People Cost per HeadCount:=DIVIDE([Total People Costs], [Total HeadCount], 0)
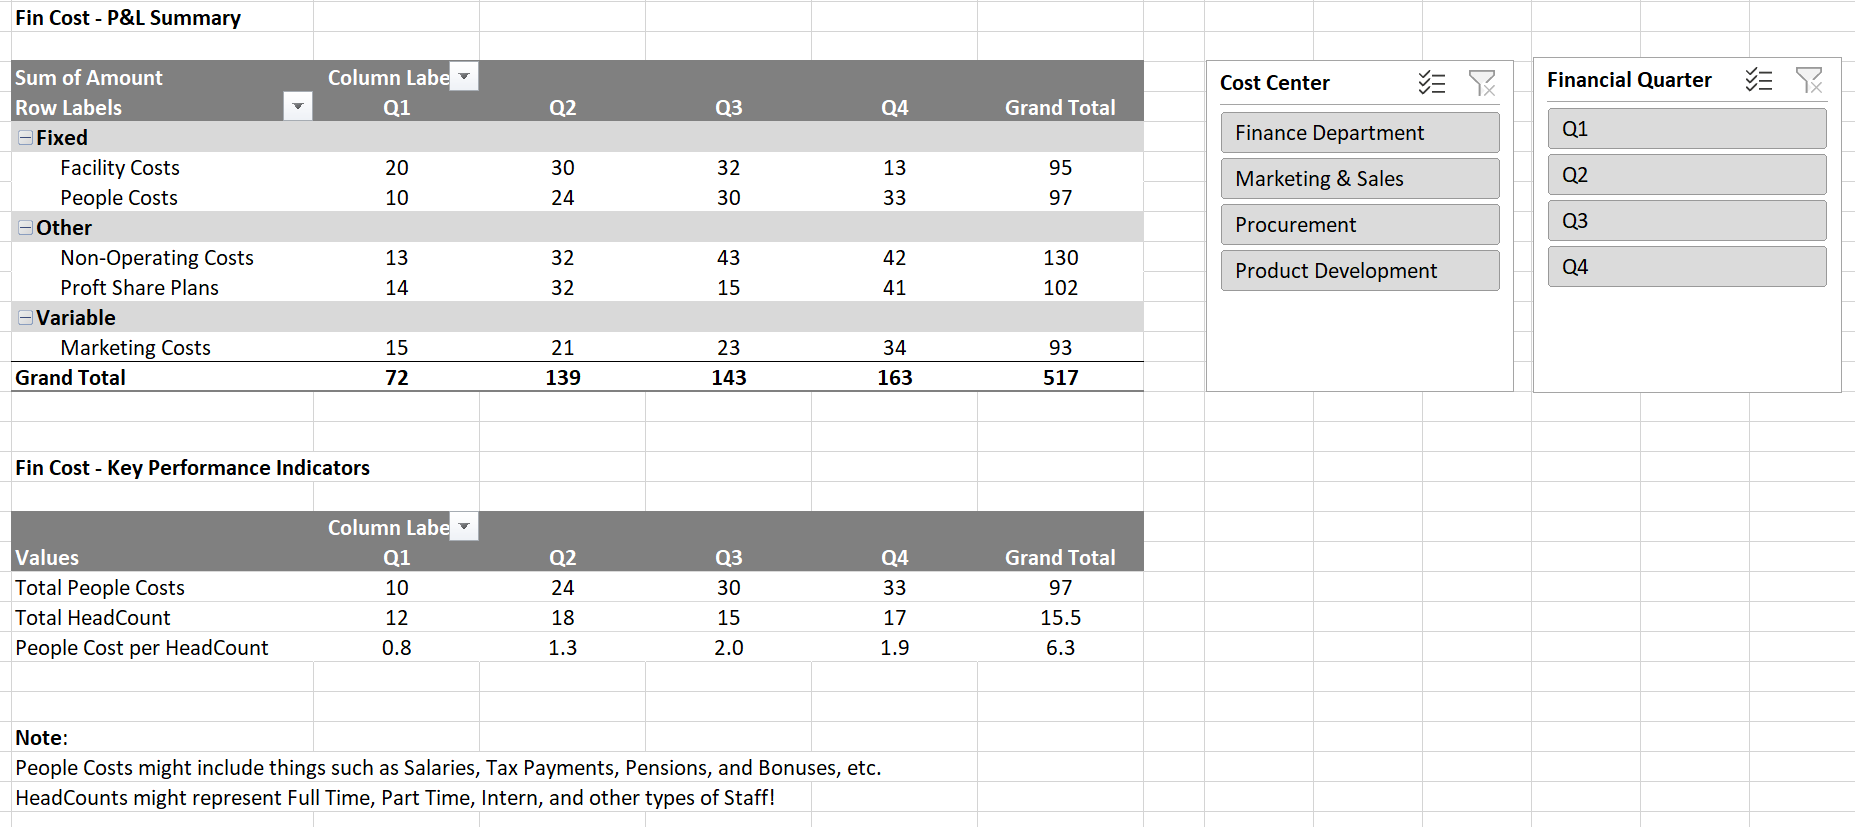
Step 6 – Creating the appropriate Financial Planning Tables in an Excel Worksheet
Once the Data Model has been created to connect all the FACT and DIMENSION tables, and create the relevant Key Performance Indicators, a Financial Planning Report like the one shown below can then be created, one that shows an aggregated view of the P&L (the relevant Financial Cost Lines), filterable for different Cost Centers, or specific Quarters.
Click to view large-sized image
Further Ideas
One possible improvement to this Report might be to also show Financial Costs, at an aggregated view, by Business Areas (instead of just by the categories: Fixed, Variable, and Other Costs). A more meaningful categorisation could be obtained from the listed Supporting and/or Primary activities shown in Porter’s Value Chain (a popular Business Framework that shows the various subsystems an organisation uses to create a product or service).
This would give a clearer, and more detailed view of how Financial Costs compare across departments (e.g. by Marketing, Product Development, Finance, Technology Development, In Bound Logistics, Procurement and so on), and hopefully a better understanding to Executives of how well different areas of the business are performing.
File to Download
The full file just described in this article can be found here: Finance - Financial Planning
See also
- Combining Stacked Headers: Note that the following example achieves a similar result when combining the stacked headers, but was done more recently (since writing this article), and, as a newer approach, (that also uses a customised function), requires many fewer steps and queries! » Read more
Feedback
Submit and view feedback