
Cross-Joining Tables
Overview
Here we explain how to cross-join two or more data tables. This is sometimes know as taking the cartesian product.
Creating Tabular Cross Joins
Here we would like tocreate a budget table for all stores in our portfolio, for a particular year.
There are a few different ways of doing this. The approach taken here is to load a set of records in a smaller budget table (one for each store) , before creating a larger table, that shows the budget across different weeks.
Steps
1. Budgets by Store
Start with a simple budget table, that shows the budget for each store, like shown below:
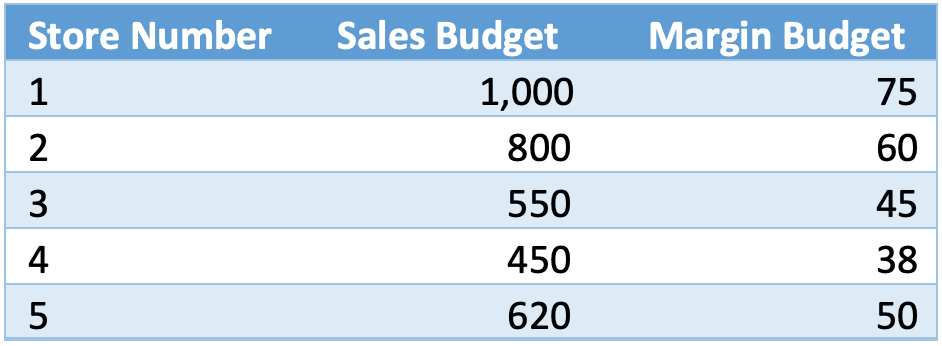
Note: In real life, there may be many more columns for Gross Profit, and some other metrics. Here we just show the Sales and Margin budgets across two separate columns.
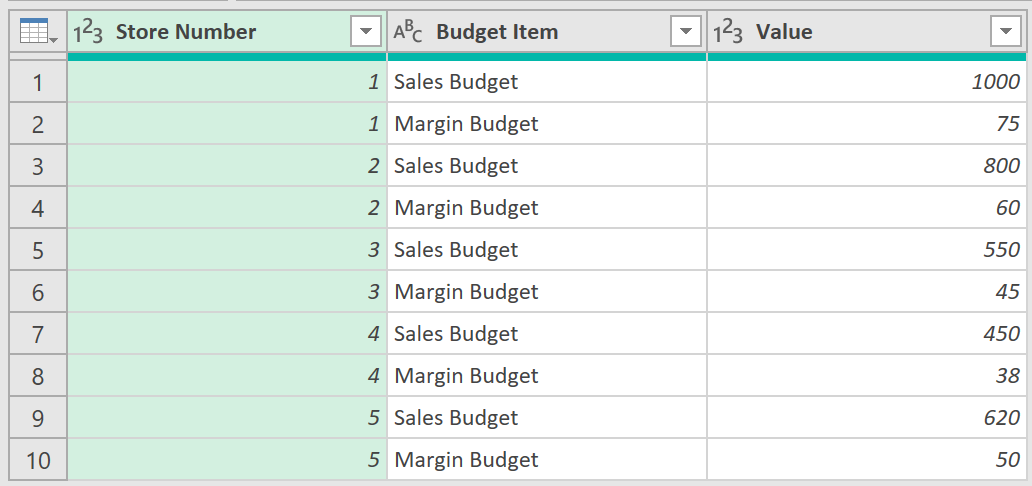
Long narrow tables are normally better, so reshape this table using Power Query, so it looks like the one below – using the ‘unpivot columns’ transformation feature.
- Click in the Table ➔ Data tab (in Excel) ➔ From Table/Range icon
- Click on the ‘Store Number’ column ➔ Right click ➔ Unpivot Other Columns
- Rename the ‘Attribute’ column to ‘Budget Item’
- Now, name the Query ‘Store_Budgets’
- Then click on ‘Close & Load to’ and set it to ‘only create connection’.
- Ensure that ‘Add to Data Model’ is unticked, as shown in the below picture:
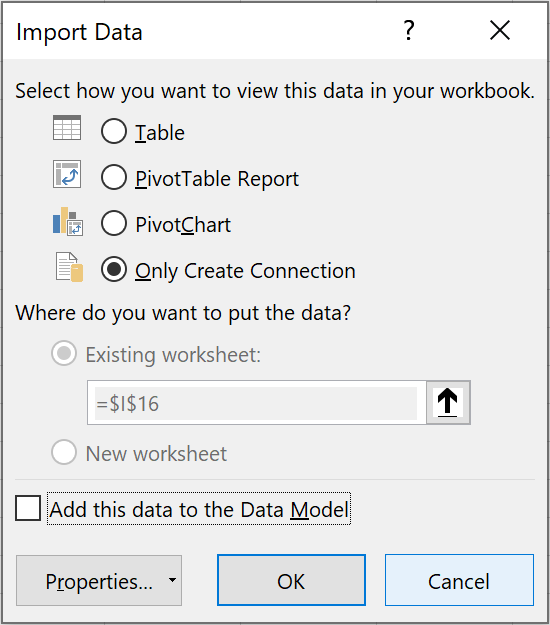
Only creating a connection makes the query available to use in other queries without actually storing the data anywhere in Excel. Each time you ‘materialise’ a query, by adding it as a table in Excel, this causes it to take up space. Only do this if you need the materialised view of the table. If not, good practice is to leave the query as a connection only.
2. Week ID Number
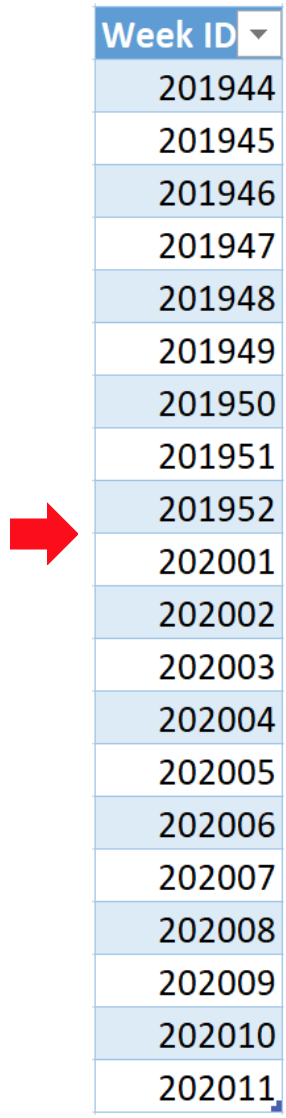
Now we need to set the budget each week for the coming 20 weeks (the budget is the same for each week). Here, we start with a weekly calendar, so week IDs are shown below in the format YYYYWW. Note the non-contiguous jump at the end of the calendar year into 2019! (indicated by the red arrow)
3. Create a List of Week IDs in PQ
A native list can be created in Power Query rather than importing it from Excel, using the following syntax using braces.
= {1..5}
The above code generates a list of numbers from 1 to 5. With this in mind, take the following next steps:
- Go to Power Query ➔ From Other Sources ➔ Blank Query
- Rename the Query to ‘Weeks’
- Write a line of code like this in the formula bar:
= {201944..201952,202001..202011}
This will generate a list of values, like shown here:
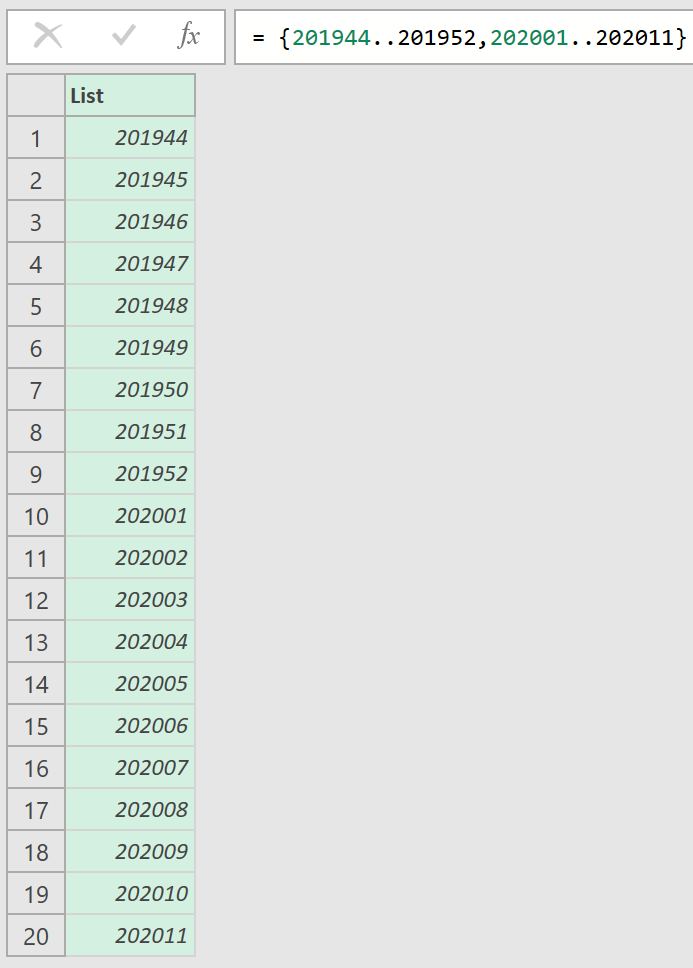
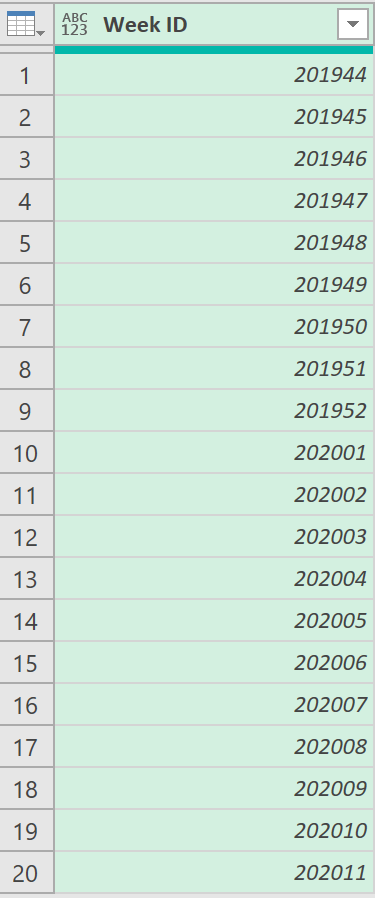
Note, at this point the query is just a ‘list’, not a ‘table’. To convert the list to a table, click ‘To Table’ icon, under the Transform tab. Then give the new table a column name, ‘Week ID’
Save the query as ‘only create connection’, so it does not materialise the table.
With both tables prepared, you are now ready to Cross Join the two tables.
4. Cross Join the Two Tables
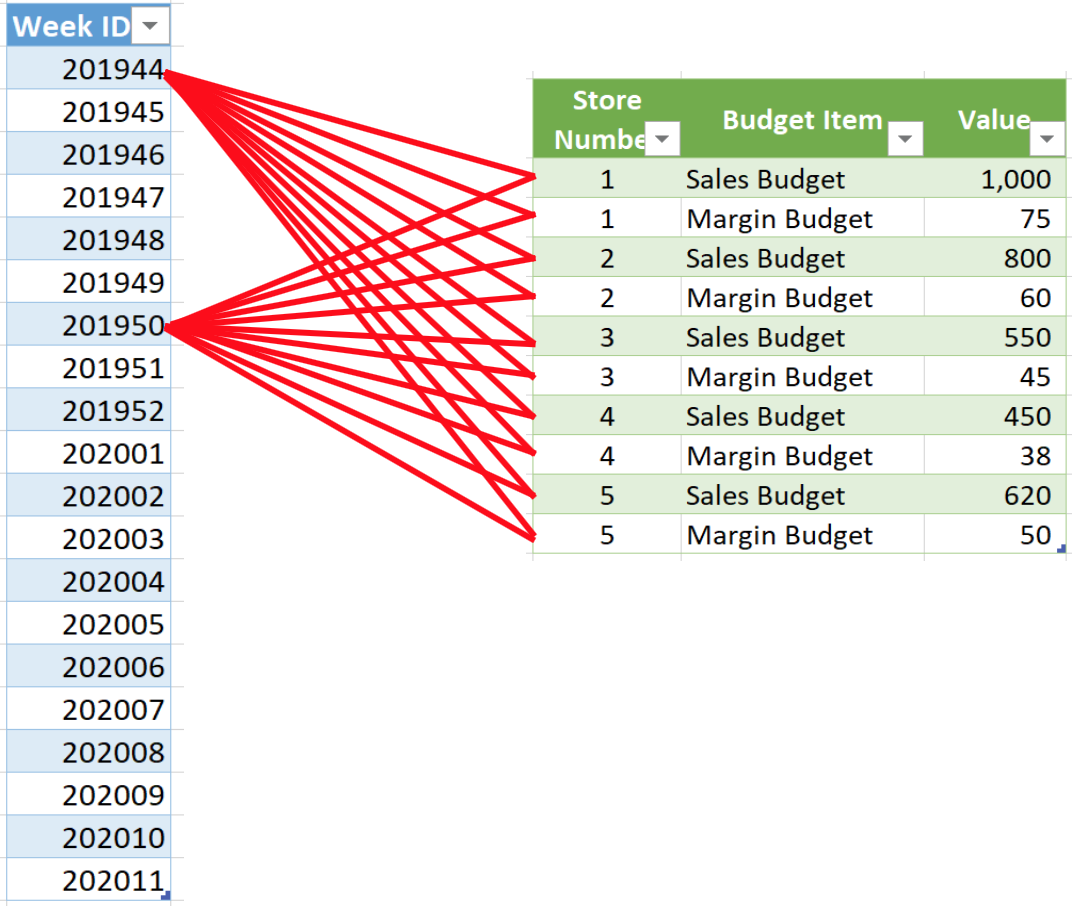
The weeks table above has 20 rows and the Budget Table has 10 rows. ‘Cross join’ means duplicating the entire Budget table for every week, adding the budget table, into each row, of the week query.
This is illustrated diagramatically below, with every possible combination, i.e. 20 x 10 = 200 rows, in the new, cross-joined table.
5. Add a Custom Column to create a Cross Join
- To do this, start by opening the Weeks Query and add a new custom column (shown below). The formula for the new column is simply the name of the Store_Budgets Query.
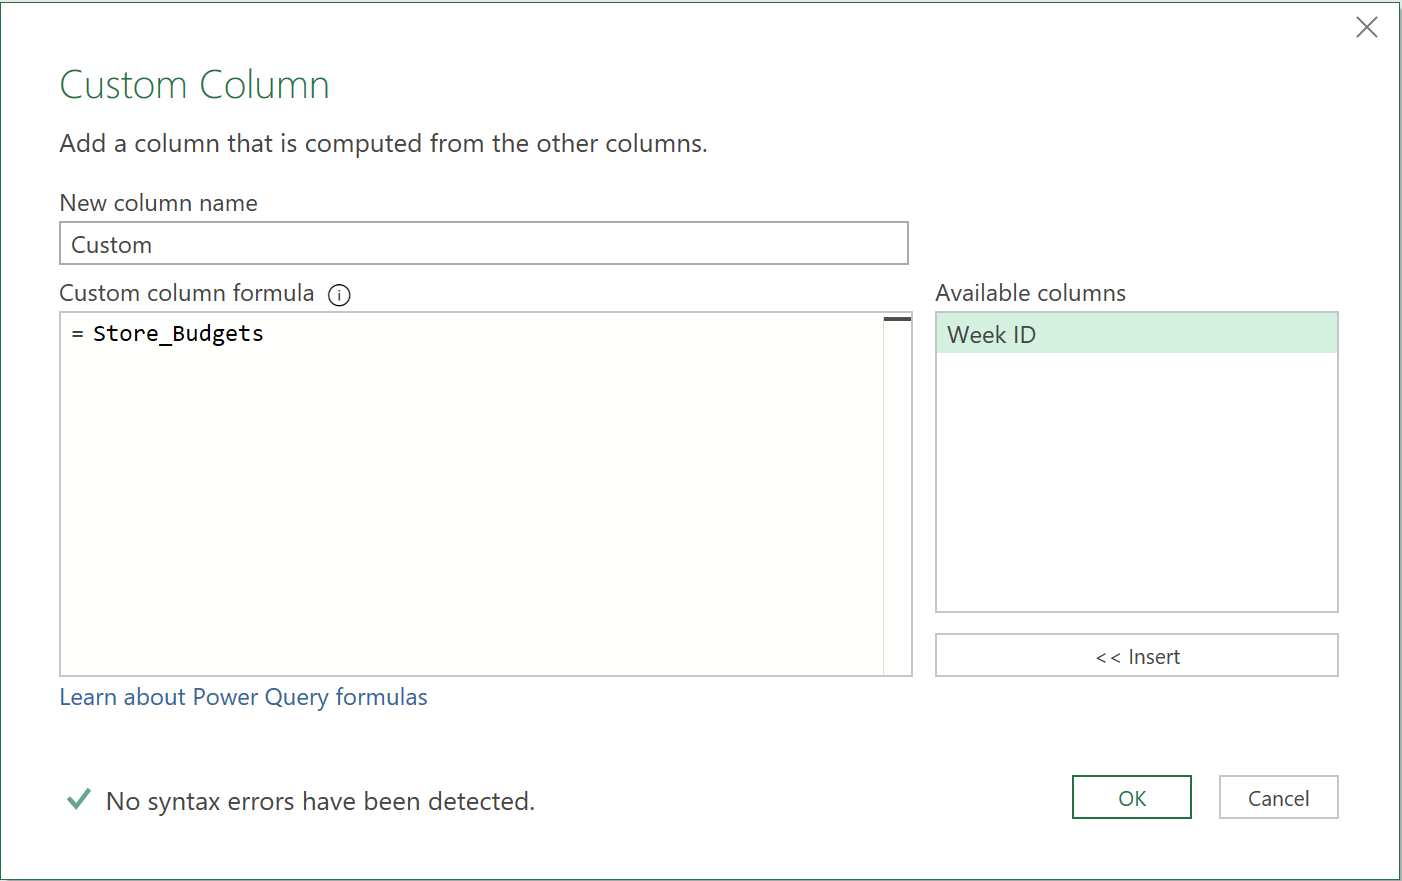
- After you click OK, you get a new column that contains the entire Budget table as an object in each row of the Weeks table (shown below).
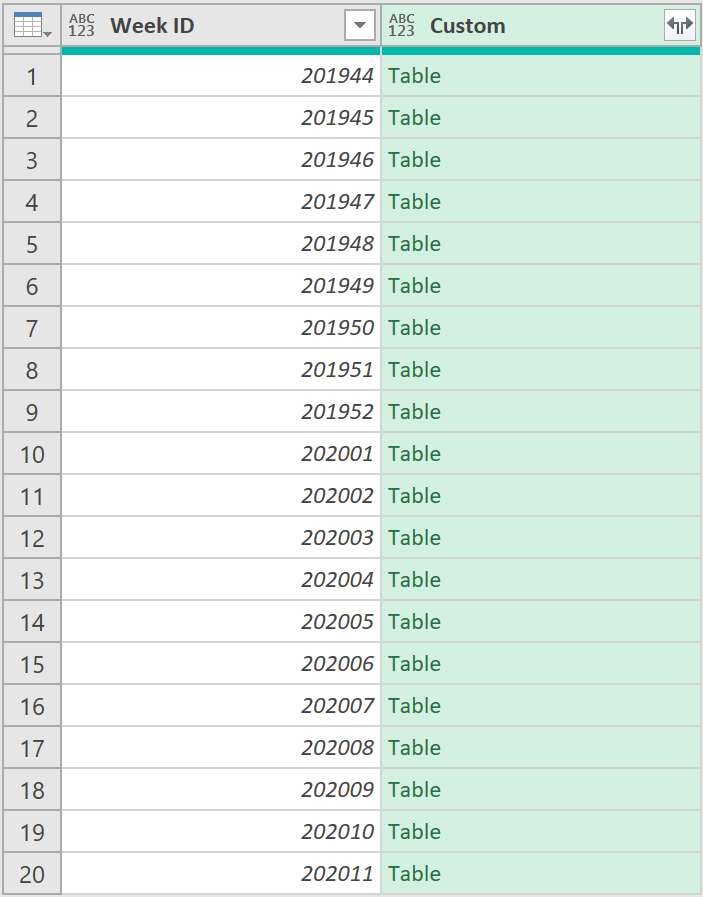
- Expand the new column by clicking the expand button to create all the possible combinations. Notice from the messaging in the bottom left that the new query now has 200 rows.
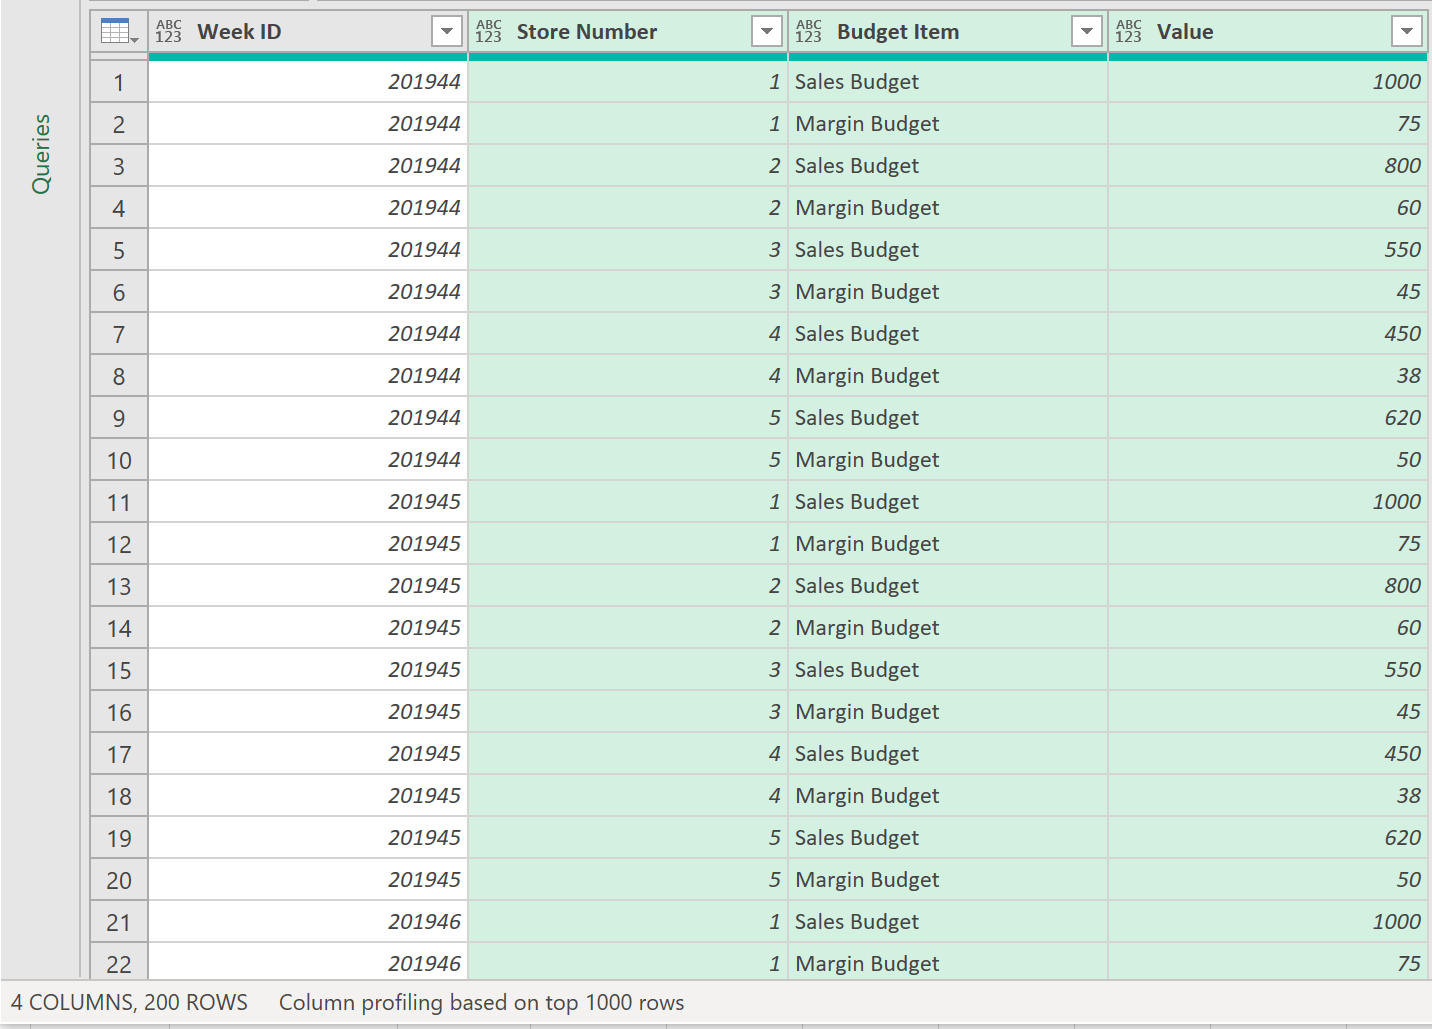
You have now succesfully cross-joined both tables! Close and Load the query to output the results to Excel.
Feedback
Submit and view feedback