Monthly to weekly budget
Overview
A common challenge with monthly budgets, in company finance departments, is that they need to be tracked against actual sales on a weekly basis, or at least on a different time-scale and granularity in which actual sales data exists.
Often, a weekly budget is created by taking the monthly prepared budget, and just dividing this by 4, for a 4-week month, or by 5 for a 5-week month.
This article explains how to do this, but in a much more automated way, which is helpful when handling live streams of financial data.
Steps
The overall approach is as follows:
- Create a 544 calendar as a mapping table. The calendar already has a YYMM column and a YYWW column. It also maps each week number to each month number (some months have 4 weeks, some have 5). This is needed for the subsequent steps.
- Load the Monthly Budget into Power Query, as a Connection only
- Create a ‘Week Count’ query, from the Calendar Table above, that tells you how many weeks there are in each month.
- Merge the Monthly Budget query with the ‘Week Count’ query, so you can see how many weeks there are in each month, alongside each month’s budget.
- Merge the 554-calendar table from step 1 with the enhanced Monthly Budget table from the earlier step. This replicates each monthly budget line, into each week of the original table - thereby creating a weekly budget table (4 rows for a 4-week month and 5 rows for a 5-week month). The only trouble up to this point, is that the budget on each line is a monthly budget and not a weekly budget
- The last step is therefore to divide the Monthly Budget by the number of weeks in the month to create a Weekly Budget.
1. Weekly 544 Calendar
- Start with a Weekly 544 Calendar table (like the one shown here…)
The calendar table used below, additionally has a ‘YYMM’, and ‘YYWW’ columns. The M-code for these is given below:
YYWW:
    = Number.FromText(
    Text.End(
    Number.ToText(
    Date.Year([Week Ending])), 2)) * 100 +
    [Fin Week]
YYMM:
    = Number.FromText(
    Text.End(
    Number.ToText(
    Date.Year([Week Ending])), 2)) * 100 +
    [Fin Month]
When the Calendar Table is loaded into Excel, (with the above two extra columns too) it should look something like this:

2. Load the Monthly Budget table
- Now, take the Monthly Budget, and load it into Power Query
- Select ‘Close & Load’ and load the Query as a ‘Connection Only’.
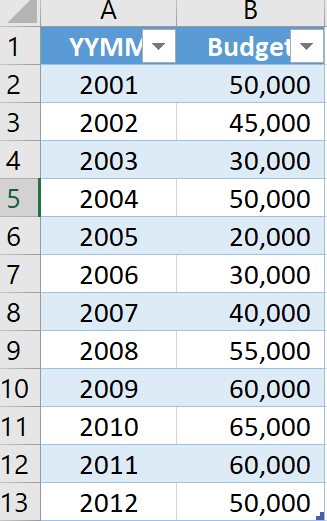
3. Create a Week Count table
Now, we need to create a Week Count Table. To do this:
- Create a reference to the Calendar Table, as shown below:
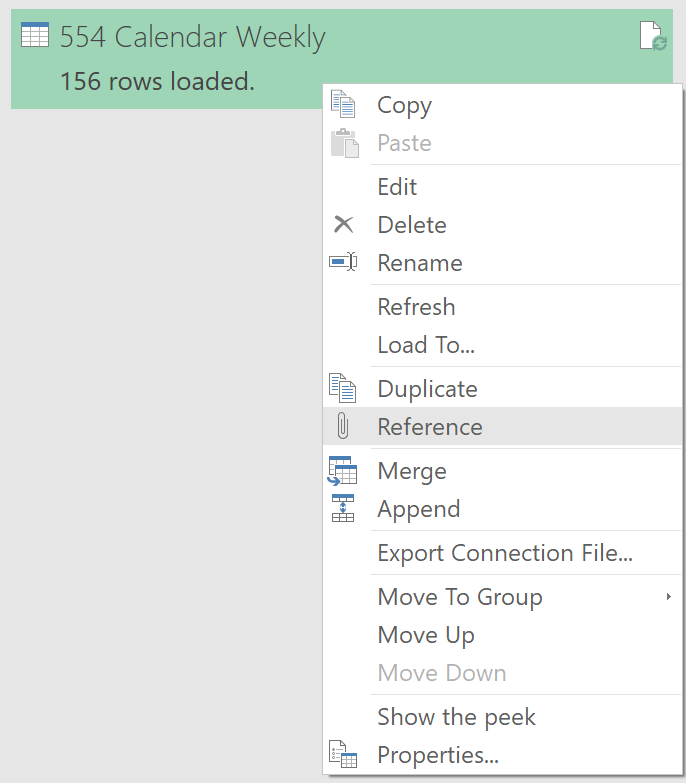
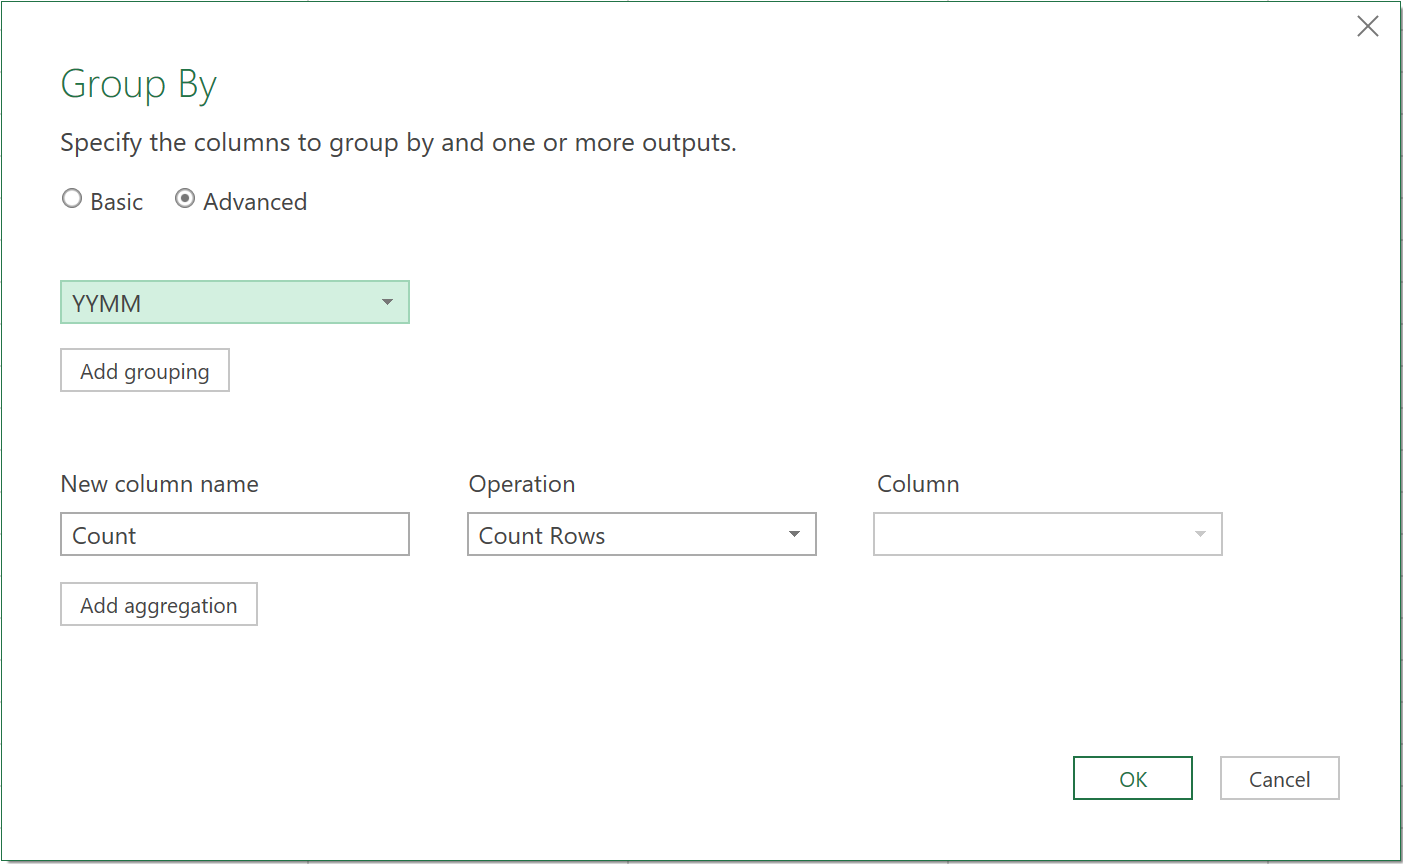
- For the referenced query, in the Query Editor, select to Group By on the column ‘YYMM’, with the other settings configured as below:
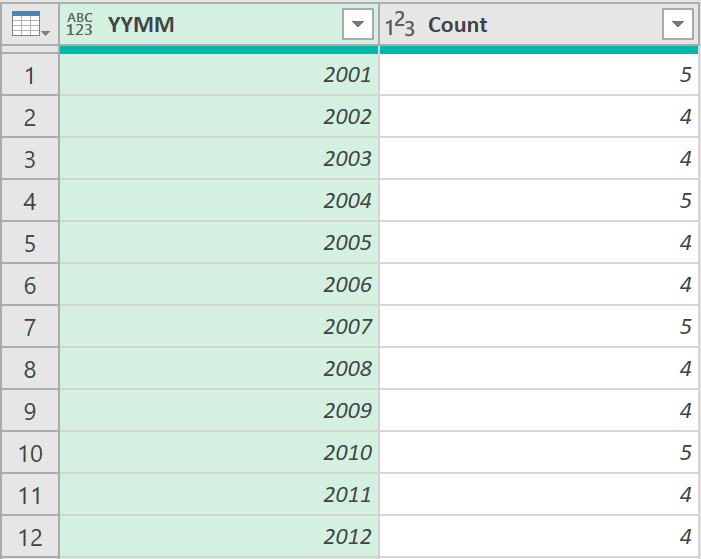
This query should now return a Week Count for each month, like shown below:
- Name the Query: ‘Week Count’
- Close & Load the query as a ‘Connection Only’.
4. Merge the Monthly Budget with the Week Count table
Now, we need to show the Week Count for each month in the Monthly Budget Query. To do this:
- Edit the Monthly Budget Query in the Query Editor
- Under the Home tab, click on the Merge Queries icon
- In the window that next appears, merge the Table with the ‘Week Count’ table
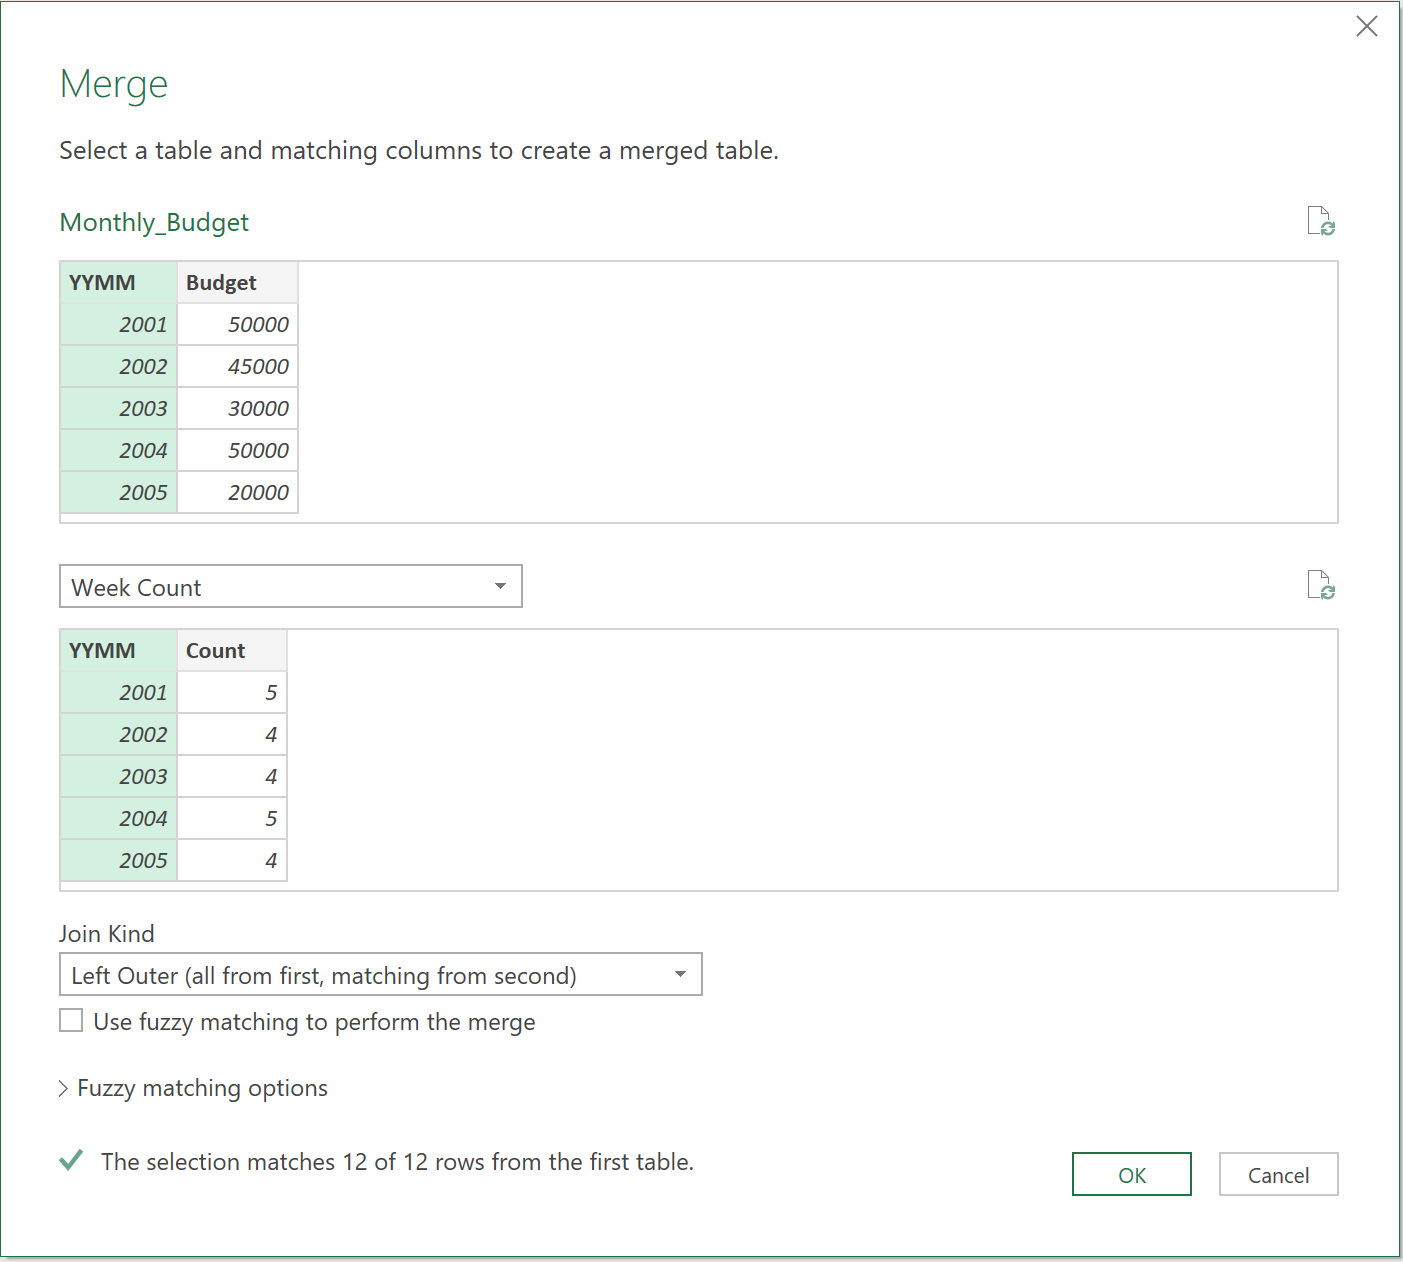
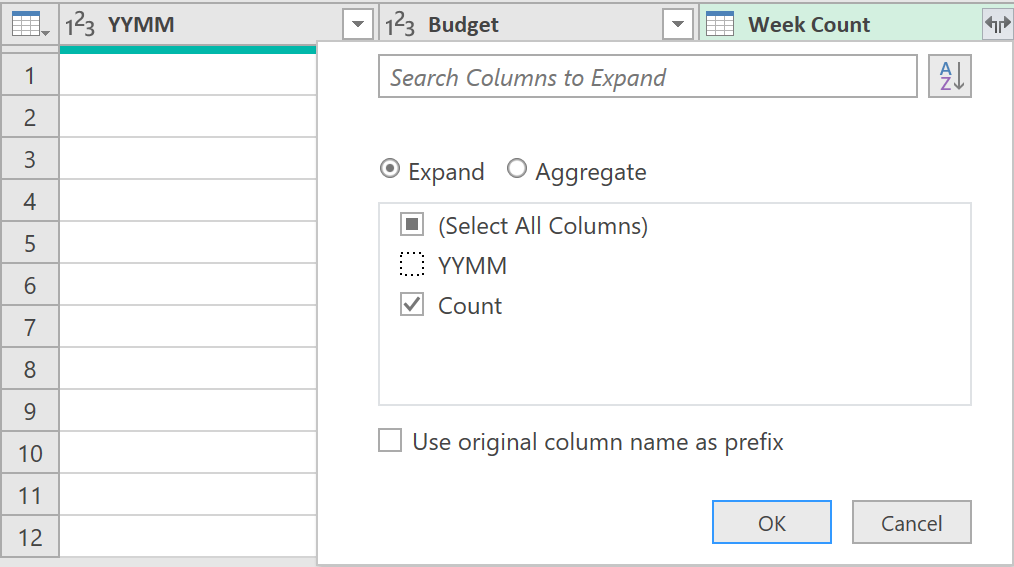
- Expand the new table so you can see the ‘Week Count’ column, as shown below:
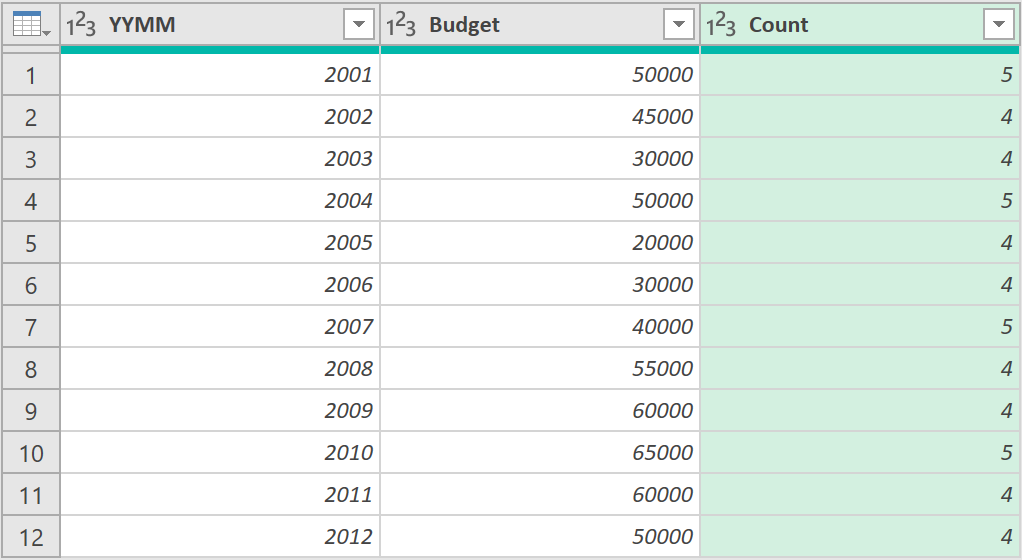
The query should now show the week count for each month against each month’s budget:
5. Merge the Calendar table with the above Monthly Budget table
Without saving this query (i.e. keep on editing from the above point), click on the Merge Queries icon again from the Power Query menu. Do another left outer join, and choose to merge on the ‘YYMM’ columns in both tables.
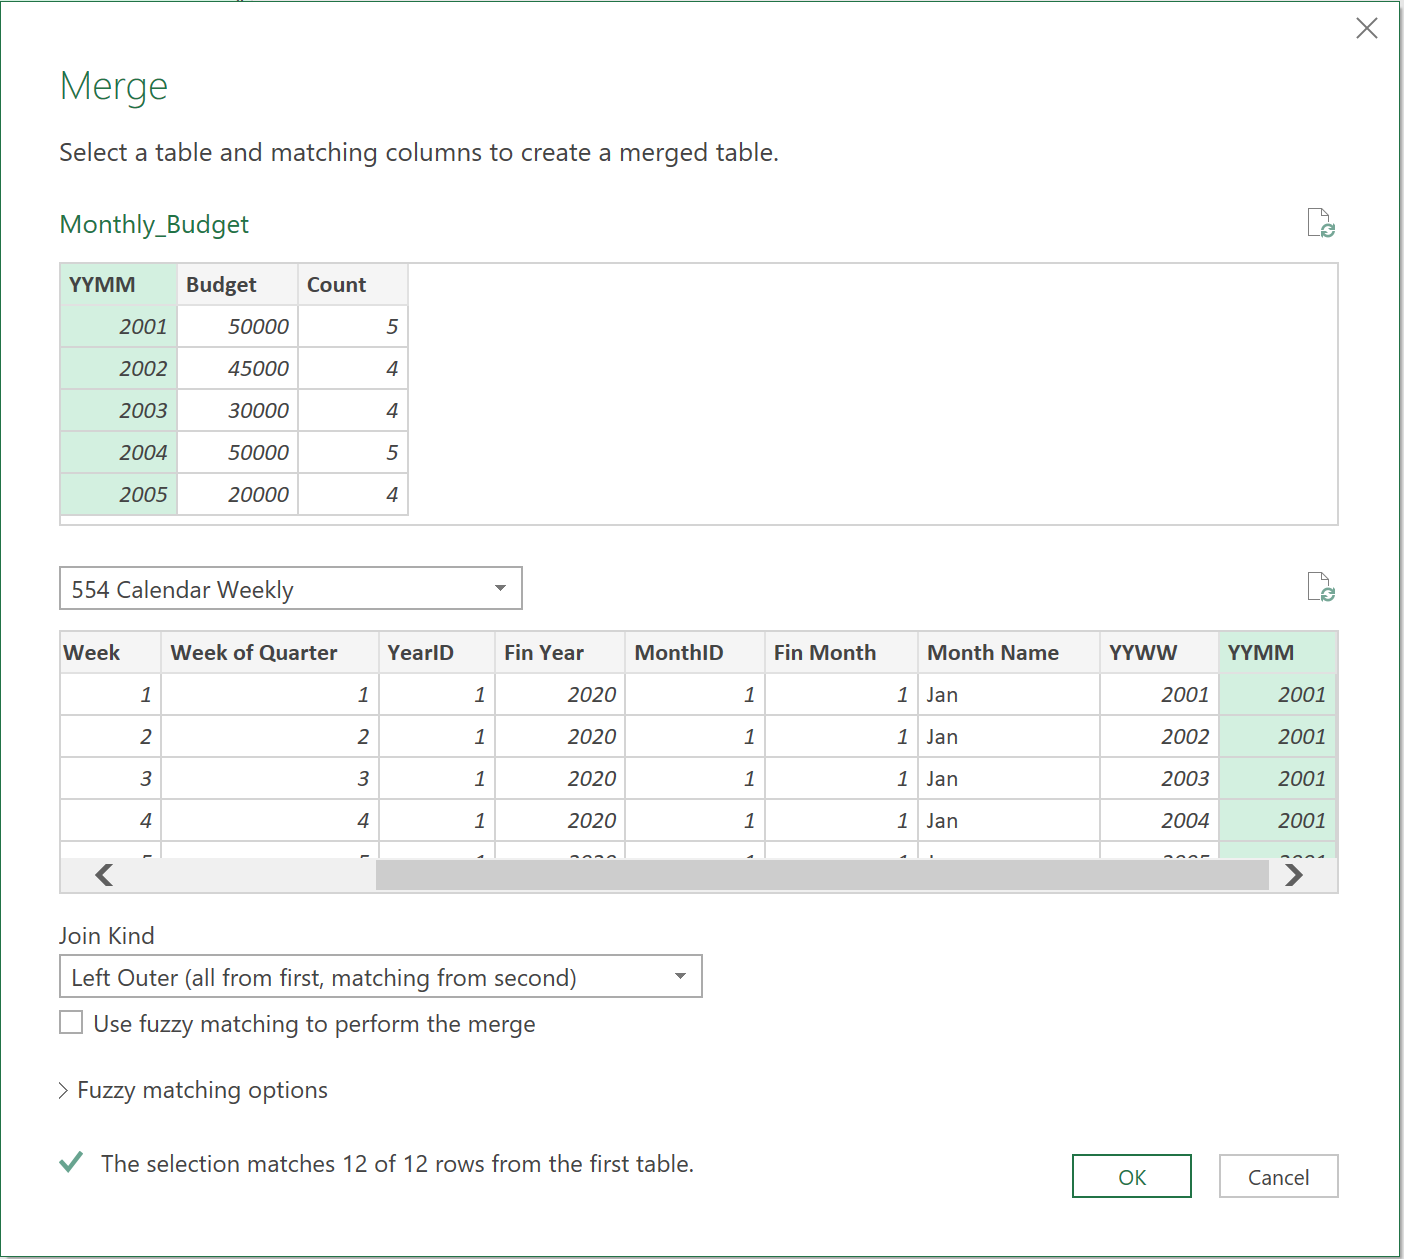
Note: The 554 Weekly Calendar Table has multiple rows for each month (4 or 5 depending on the month). When you join two tables like this, that have a 1 to many relationship (1 row in the budget table matching many rows in the Weeky calendar table) it has the effect of replicating the rows of the first table once for every match in the second table.
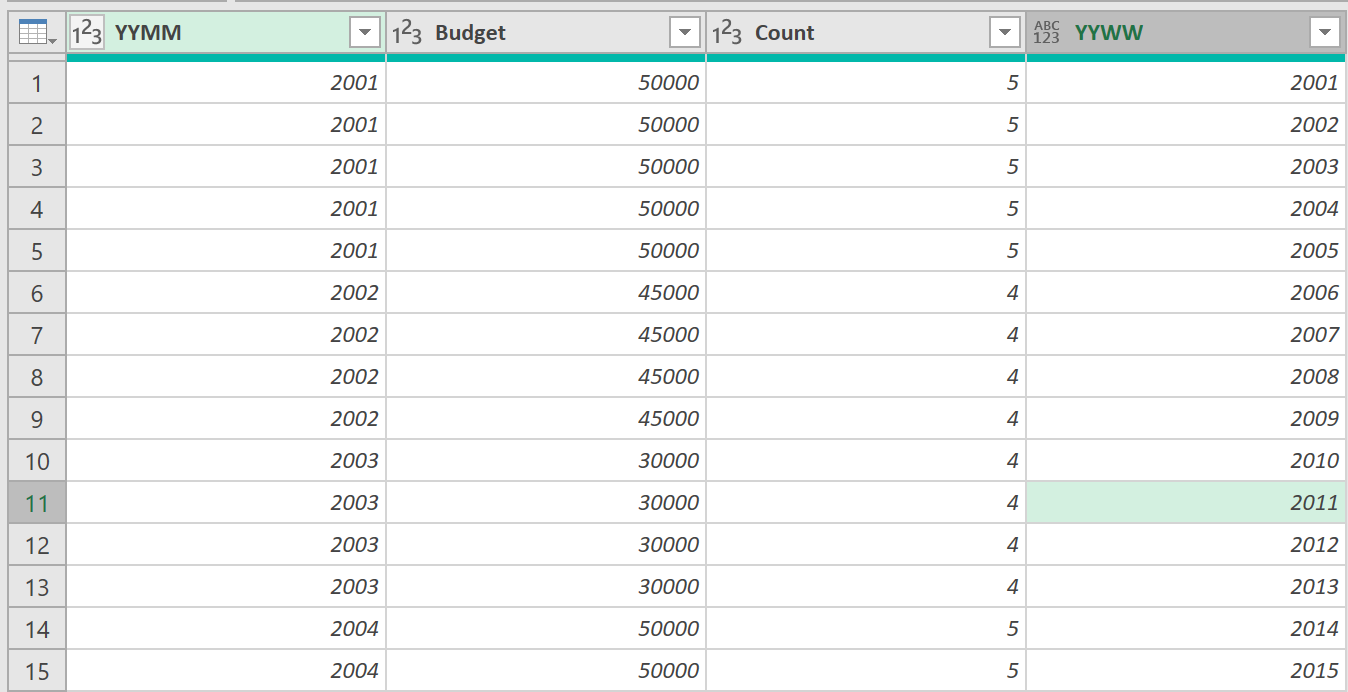
After merging both tables, and expanding the joined table, to show the ‘YYWW’ column, you will therefore see that the Budget Table extends to 52 rows instead of the original 12. The top half of this table is shown below:
6. Create a Weekly Budget column
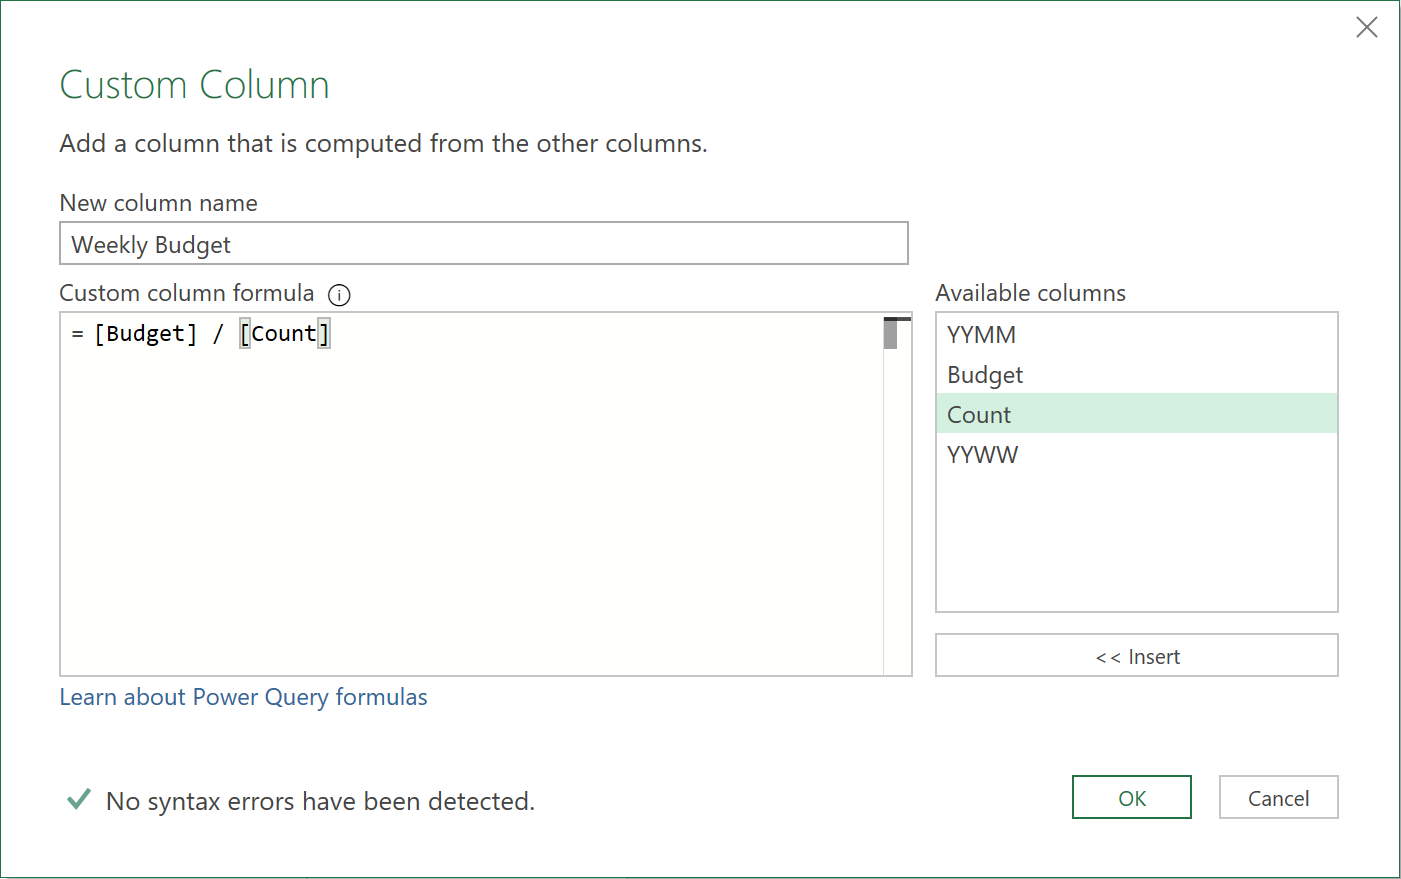
With the Budget Table expanded to show each week, now all that is left to do, is divide the Budget column (which is the monthly budget) by the number of weeks, to get to a weekly budget.
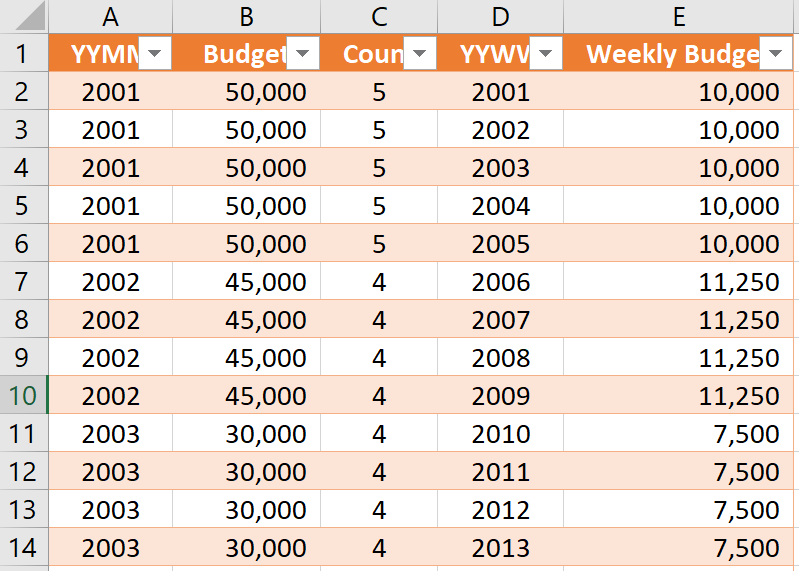
- Finally, close & Load this query as a “Table” in Excel (rather than a “Connection’).
The Query should load into Excel, as follows:
7. Review query dependencies
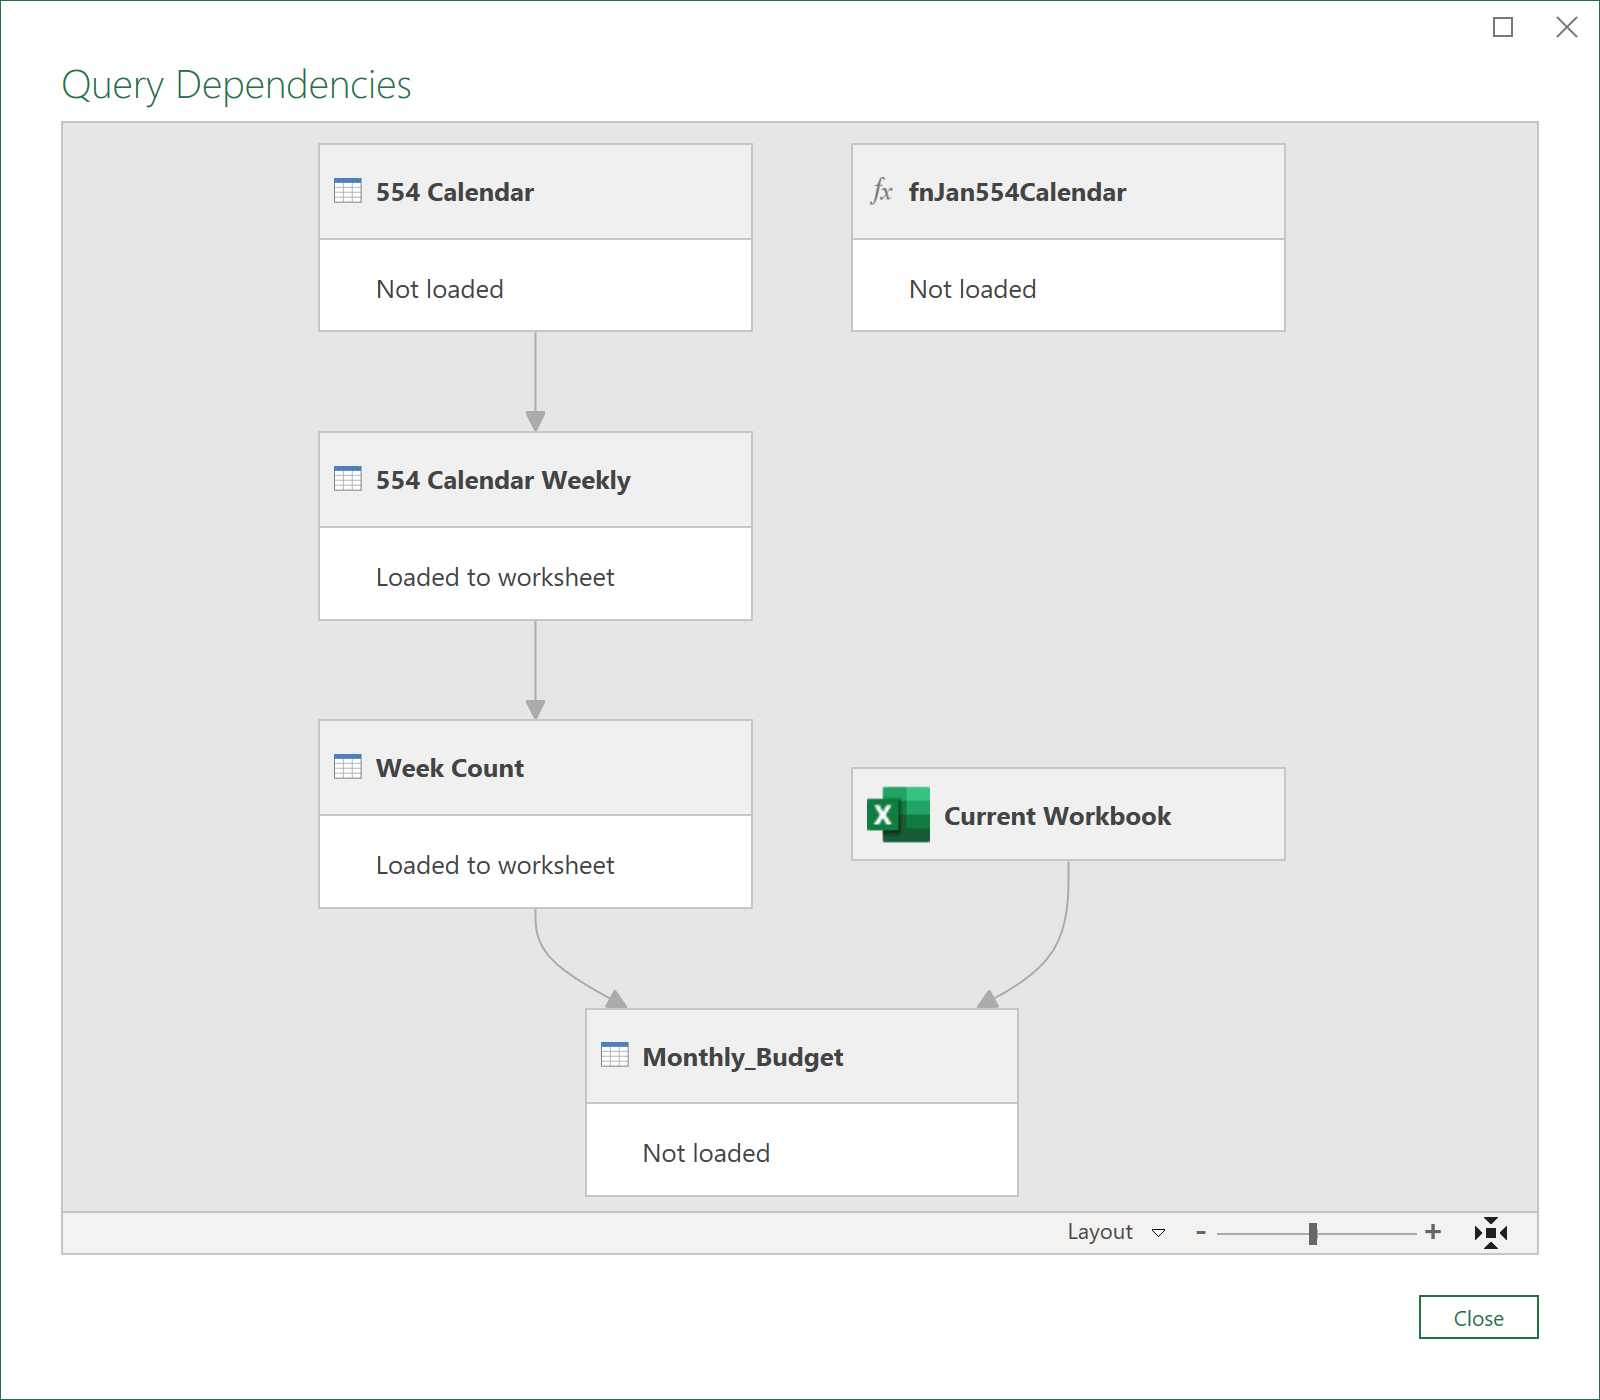
The final Query dependencies should look like this:
Feedback
Submit and view feedback

