
HR - Showing Inventory Utilisation over time
HR - Showing Inventory Utilisation over time
This sample takes the Inventory Utilisation dataset created at the end of this ETL article: HR - Inventory Utilisation, to show, from this:
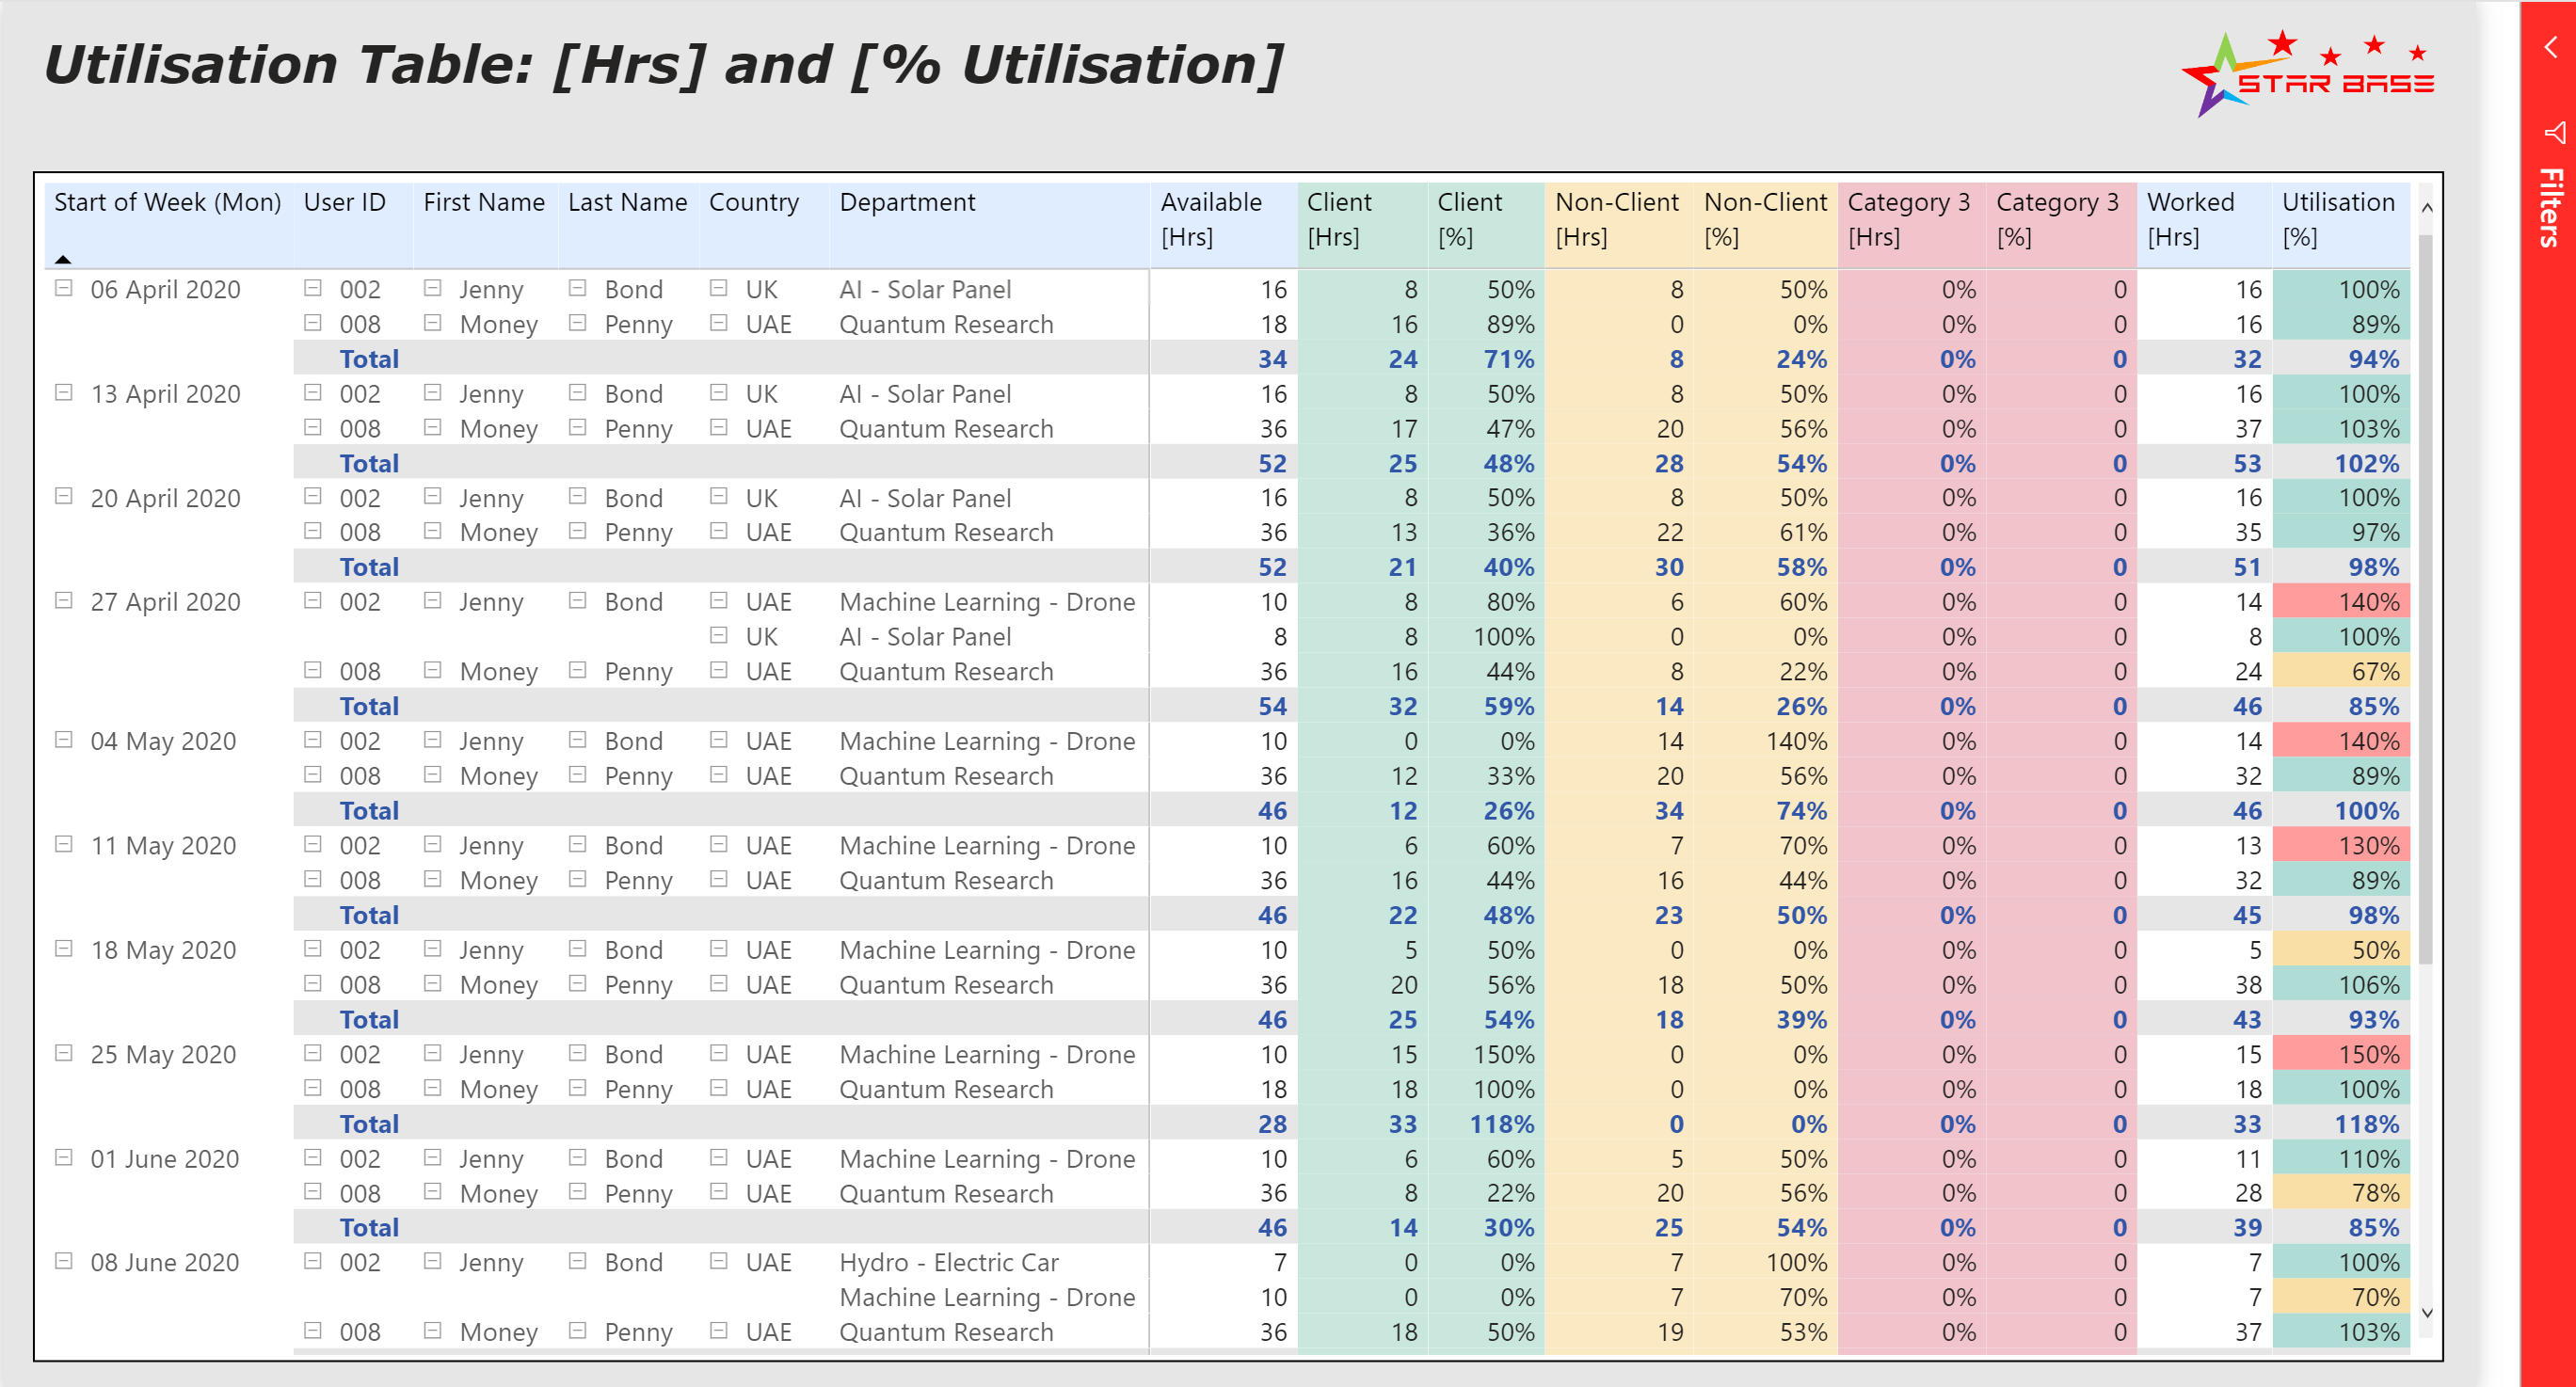
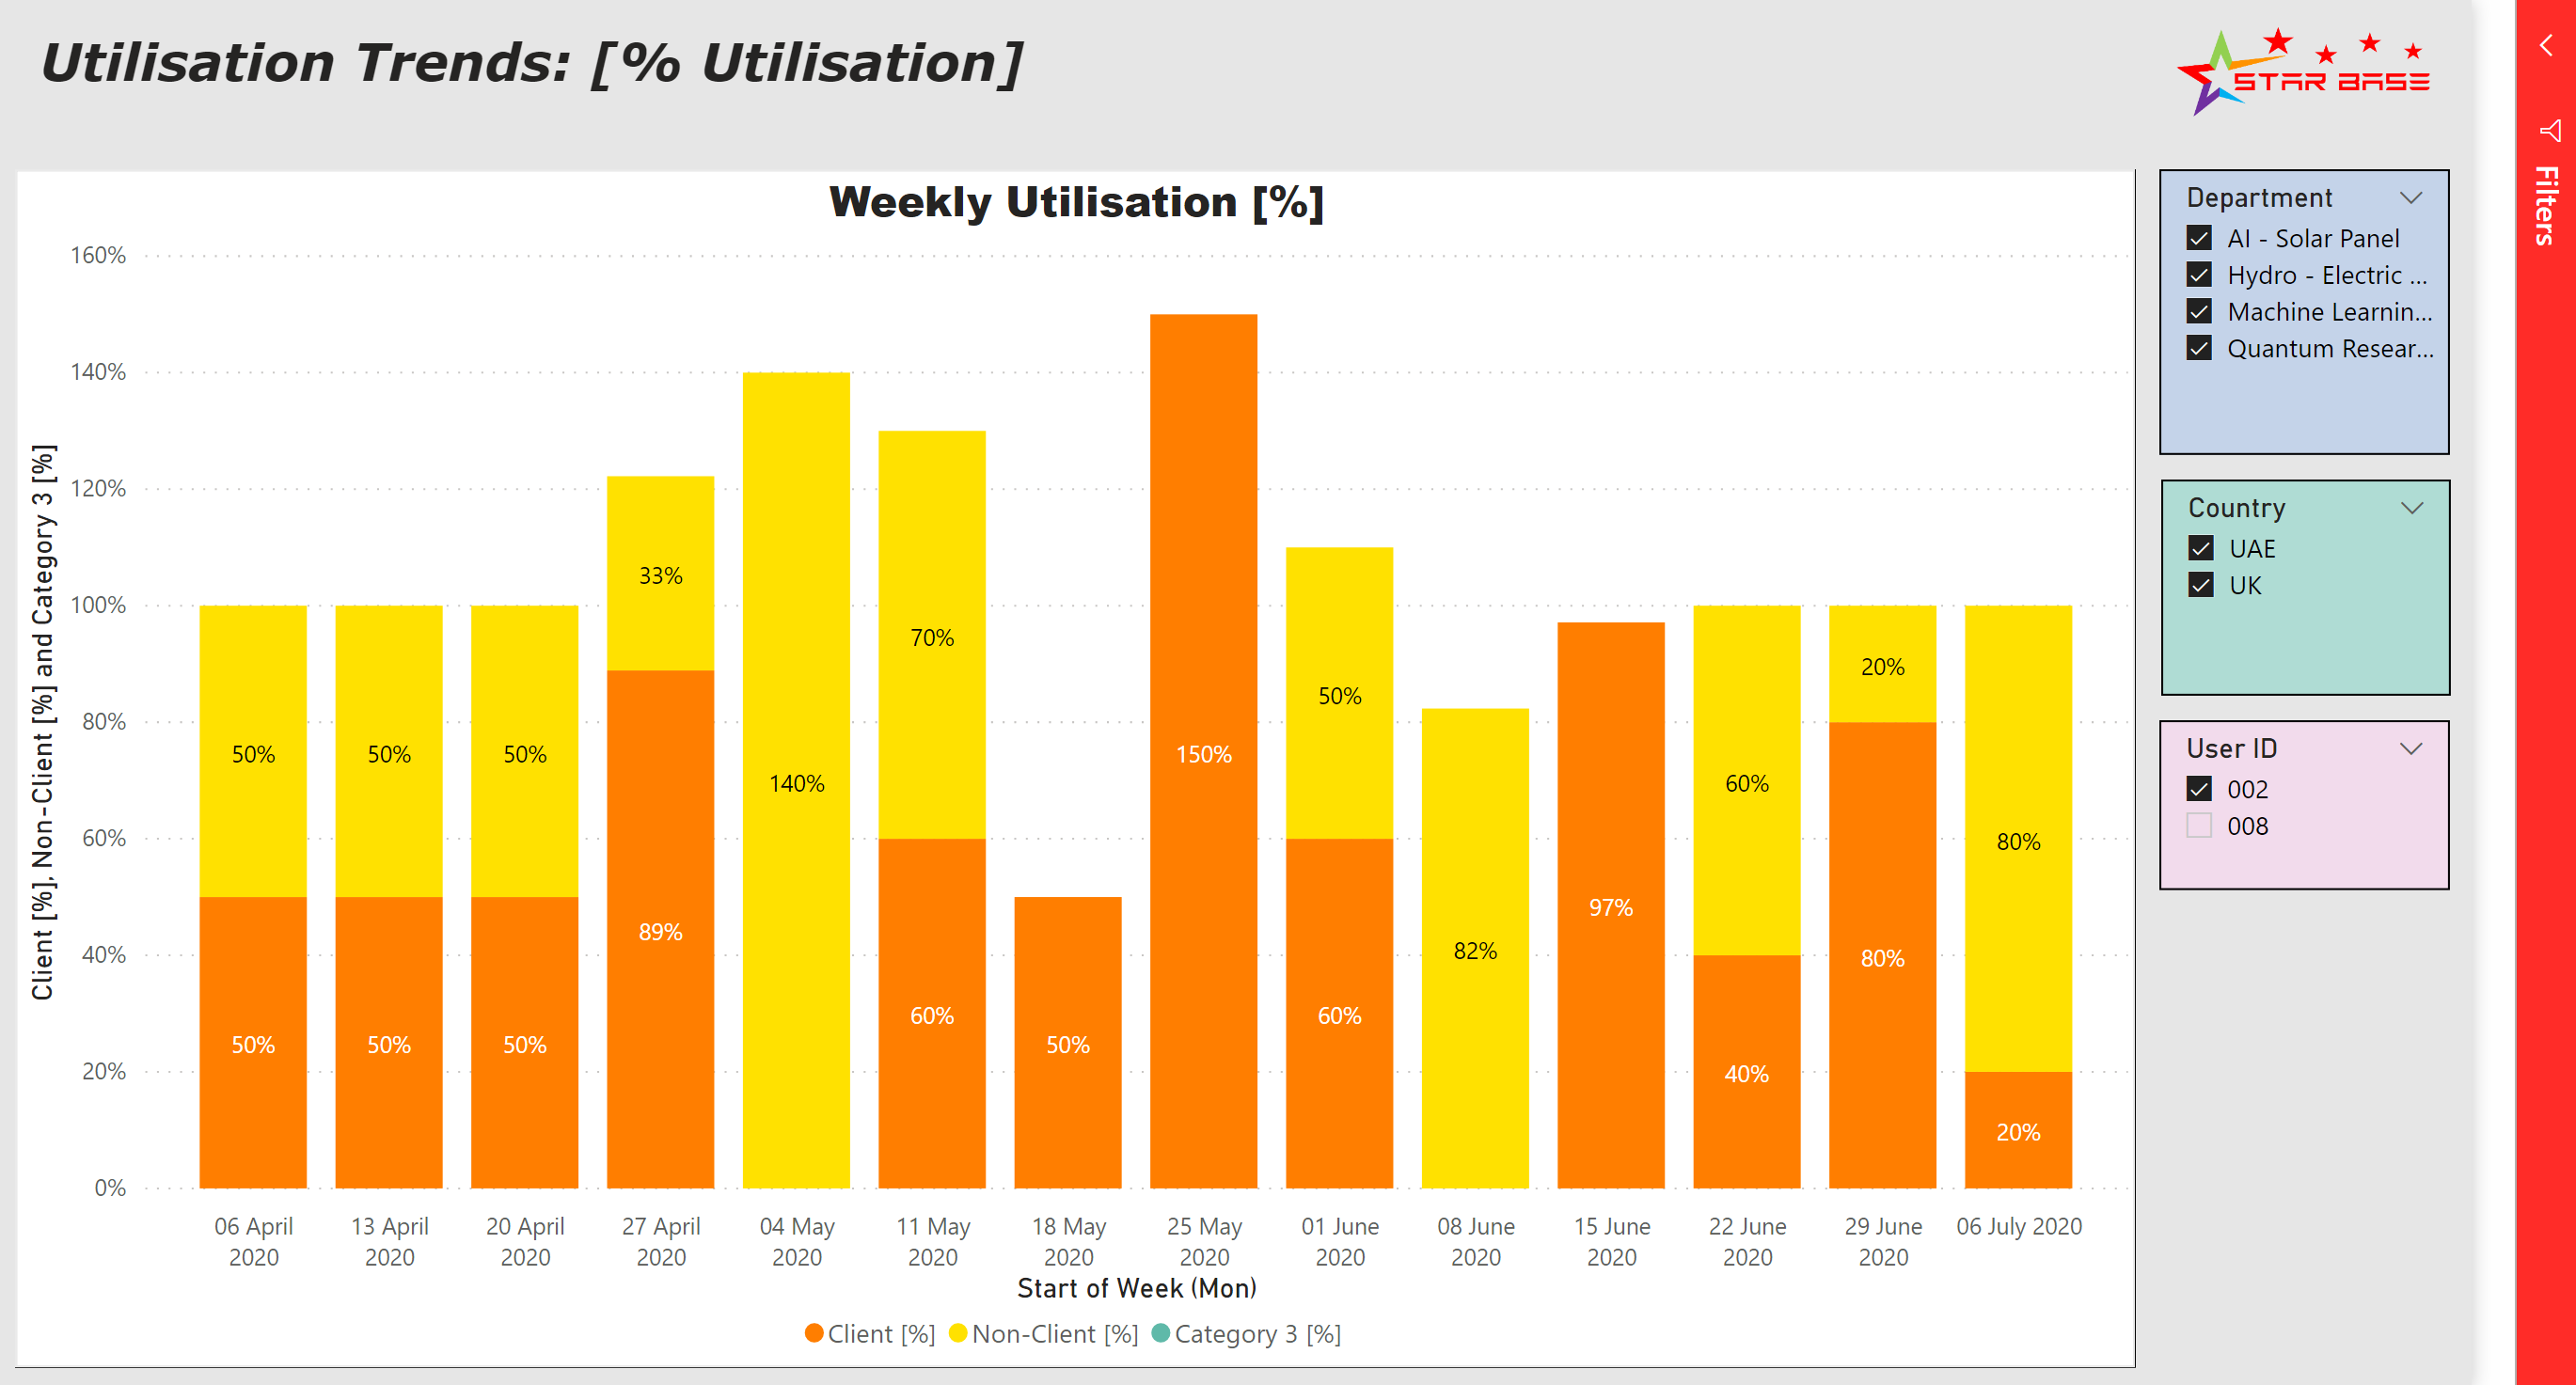
Inventory Utilisation
(i) As a table, for each Employee, on a weekly basis, by three main time categories: Client, Non-Client, and Category 3
(ii) As a stacked bar chart, filterable, by Country, Department, and Employee
Model Extensions & Adaptations
Possible extensions to this model, could include:
- Setting Target Utilisations, for each main Time type Category.
- Excluding Absent Hours – (other than Public Holidays, as these are already excluded), such as Sickness, Annual Leave, Time off in Lieu, Maternity/Paternity Leave, Furloughed, Sabbaticals, etc., from both the numerator: Worked Hours, and denominator: Available Hours of the Inventory Utilisation calculation
- Showing Utilisations on a Monthly level as well, or, if needed, Hourly basis
- Adding ‘Job Grade’, ‘Office’, and ‘Freelance or Permanent’ as extra fields, in addition to ‘Country’ and ‘Department’, to each Employee record in the Availability data (if supported by your company ERP)
- Freelance records could be automatically linked and created from their agency Timesheet submissions.
- Adding extra fields, such as ‘Project Code’, ‘Internal Codes’, and ‘Status Codes’ to the Timesheet data, to get more accurate and granular timesheet tracking
- Filtering for just important clients, for example, if you wanted to see Client Hours booked by staff to your top 2 or 3 most important clients, as a percentage of total Client Hours booked by these staff.
- Consideration of ‘Annual Leave’, and ‘Toil hours’ on Availability. For past dates, these hours will probably already be on the Actual (Inventory Use) Timesheet, so can be taken from they. For future dates, these hours may not be on the Timesheet, and so may need to be obtained from a separate ‘Annual Leave’ report.
Dashboard - Snippet
Click to view large-sized image
Click to view large-sized image
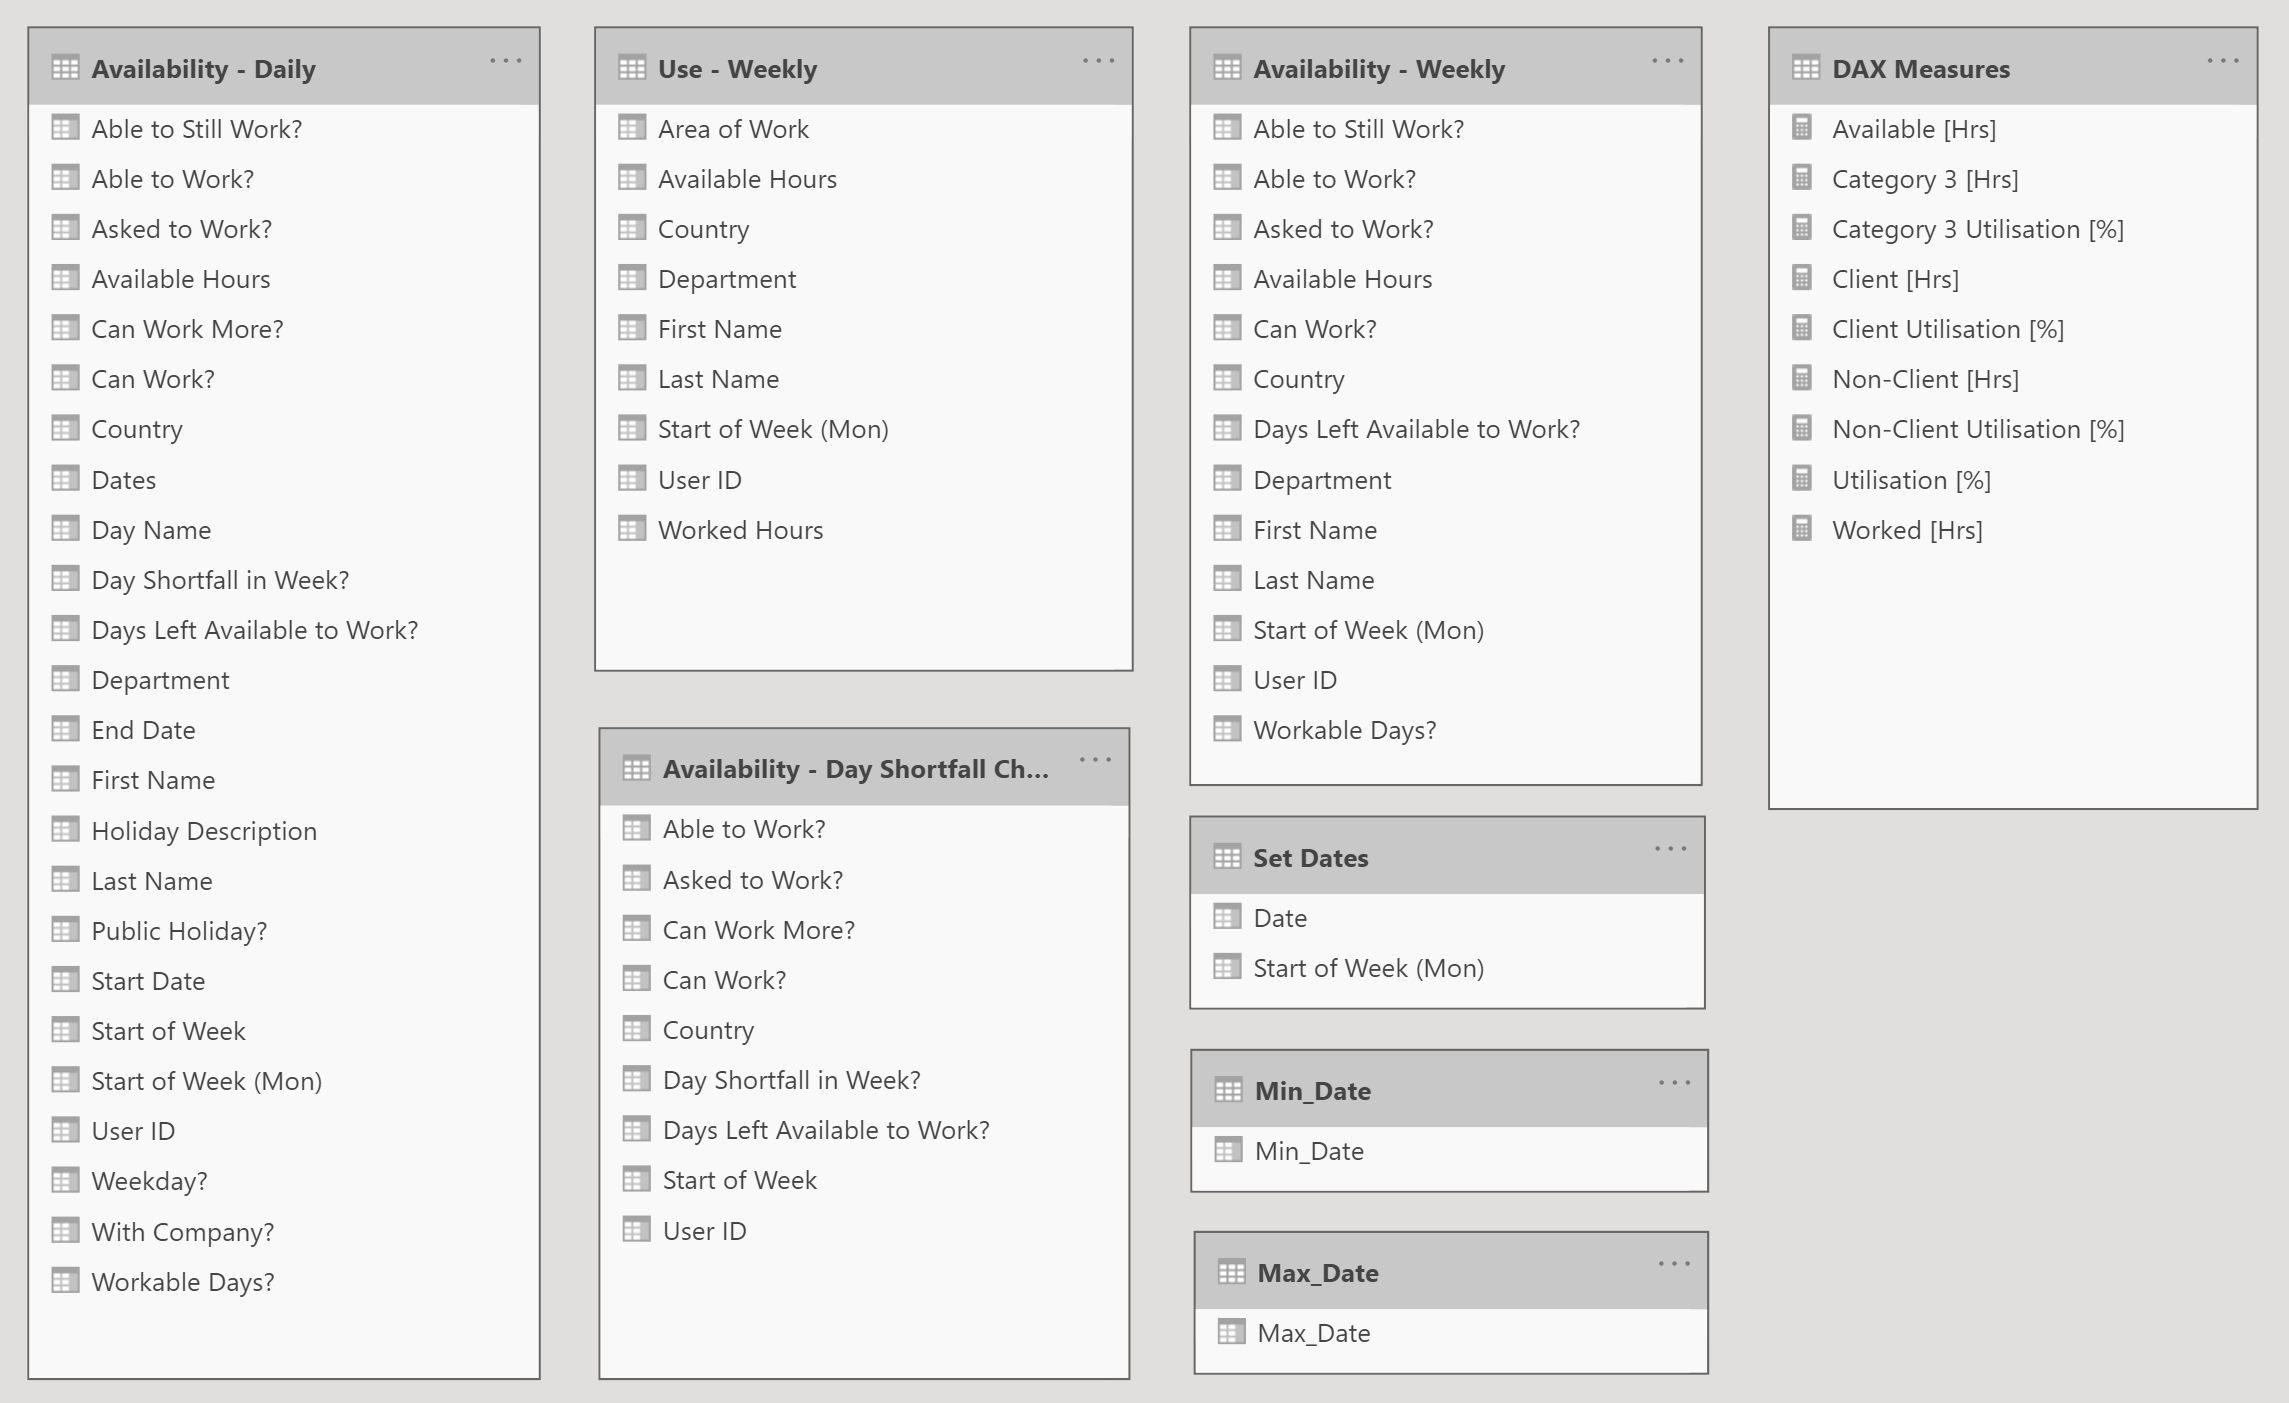
Data Model - Snippet
Click to view large-sized image
Measures
Available [Hrs]
DAX
[Available [Hrs]]] = SUMX (
    ADDCOLUMNS (
        GROUPBY (
            'Use - Weekly',
            [Start of Week (Mon)],
            [User ID],
            [Country],
            [Department]
        ),
        "Available Hrs", CALCULATE ( AVERAGE ( 'Use - Weekly'[Available Hours] ) )
    ),
    [Available Hrs]
)
Category 3 [Hrs]
DAX
[Category 3 [Hrs]]] = CALCULATE (
    SUM ( 'Use - Weekly'[Worked Hours] ),
    'Use - Weekly'[Area of Work] = "Category 3"
)
Category 3 Utilisation [%]
DAX
[Category 3 Utilisation [%]]] = DIVIDE ( [Category 3 [Hrs]]], [Available [Hrs]]], BLANK () )
Client [Hrs]
DAX
[Client [Hrs]]] = CALCULATE (
    SUM ( 'Use - Weekly'[Worked Hours] ),
    'Use - Weekly'[Area of Work] = "Client"
)
Client Utilisation [%]
DAX
[Client Utilisation [%]]] = DIVIDE ( [Client [Hrs]]], [Available [Hrs]]], BLANK () )
Non-Client [Hrs]
DAX
[Non-Client [Hrs]]] = CALCULATE (
    SUM ( 'Use - Weekly'[Worked Hours] ),
    'Use - Weekly'[Area of Work] = "Non-Client"
)
Non-Client Utilisation [%]
DAX
[Non-Client Utilisation [%]]] = DIVIDE ( [Non-Client [Hrs]]], [Available [Hrs]]], BLANK () )
Utilisation [%]
DAX
[Utilisation [%]]] = DIVIDE ( [Worked [Hrs]]], [Available [Hrs]]], BLANK () )
Worked [Hrs]
DAX
[Worked [Hrs]]] = CALCULATE ( SUM ( 'Use - Weekly'[Worked Hours] ) )
Feedback
Submit and view feedback